 HydroNode
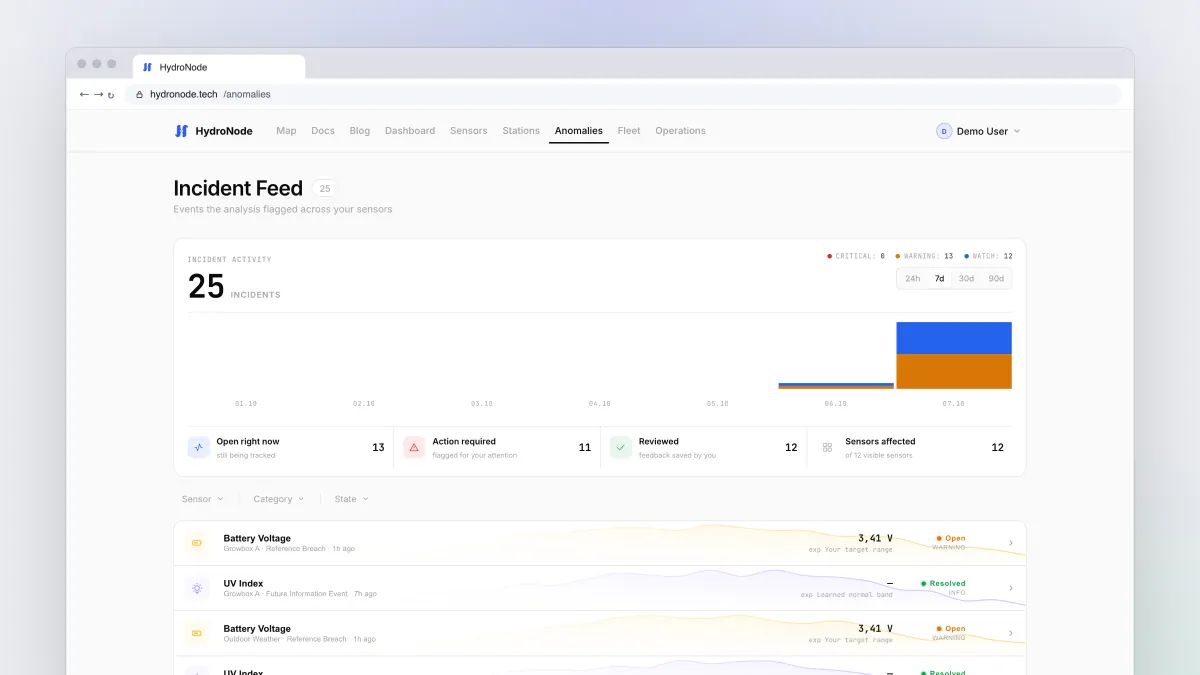
A sensor that raises the alarm over every little thing gets muted within three days. HydroNode should only interrupt you when there is something worth seeing. This post explains how it decides what is unusual, and the three places where you tune that for your sensor.
Three checks for every reading
How HydroNode learns what is normal
For each measurement HydroNode builds a model from the hourly averages of the last 28 days, with recent days weighing more. A warm afternoon is therefore not flagged just because the night was cool.
| Stage | Needs | What changes |
|---|---|---|
| First reading | Nothing | Targets and guidelines are checked. |
| Learned band | 20 readings over at least 6 hours | Statistical checks start. |
| Daily pattern | 3 days with good coverage | The time of day is taken into account. |
| Full pattern | 7 days | The daily pattern is fully trusted. |
Single outliers do not shift what counts as normal. A new level that stays stable for six hours is accepted, for example after you moved the sensor. A level that breaks a target or guideline is never accepted: air that is always bad stays bad.
One incident per problem
A problem that keeps going stays one incident. New readings update it instead of opening new ones. It is only resolved after at least two good readings and ten minutes. Missing data never resolves anything.
- OpenThe problem is confirmed
- OngoingStill there, may get worse
- RecoveringValues back in range
- ResolvedTwo good readings, 10 minutes
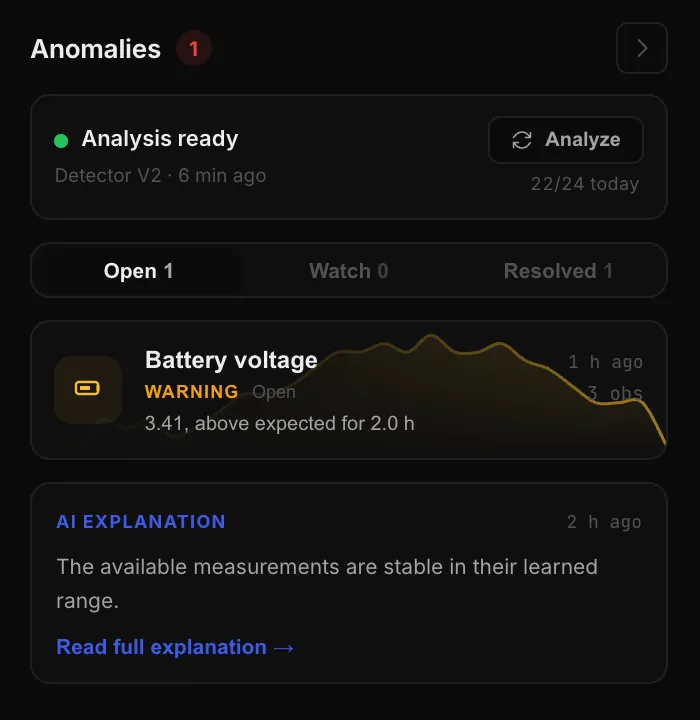
Incidents show up in two places: in the anomaly panel on the right of the sensor page, and for all sensors under Anomalies. A click shows the trigger, the rule, the readings around it and what to do. Once you rate an incident, it moves to Reviewed.
Dial 1: sensitivity
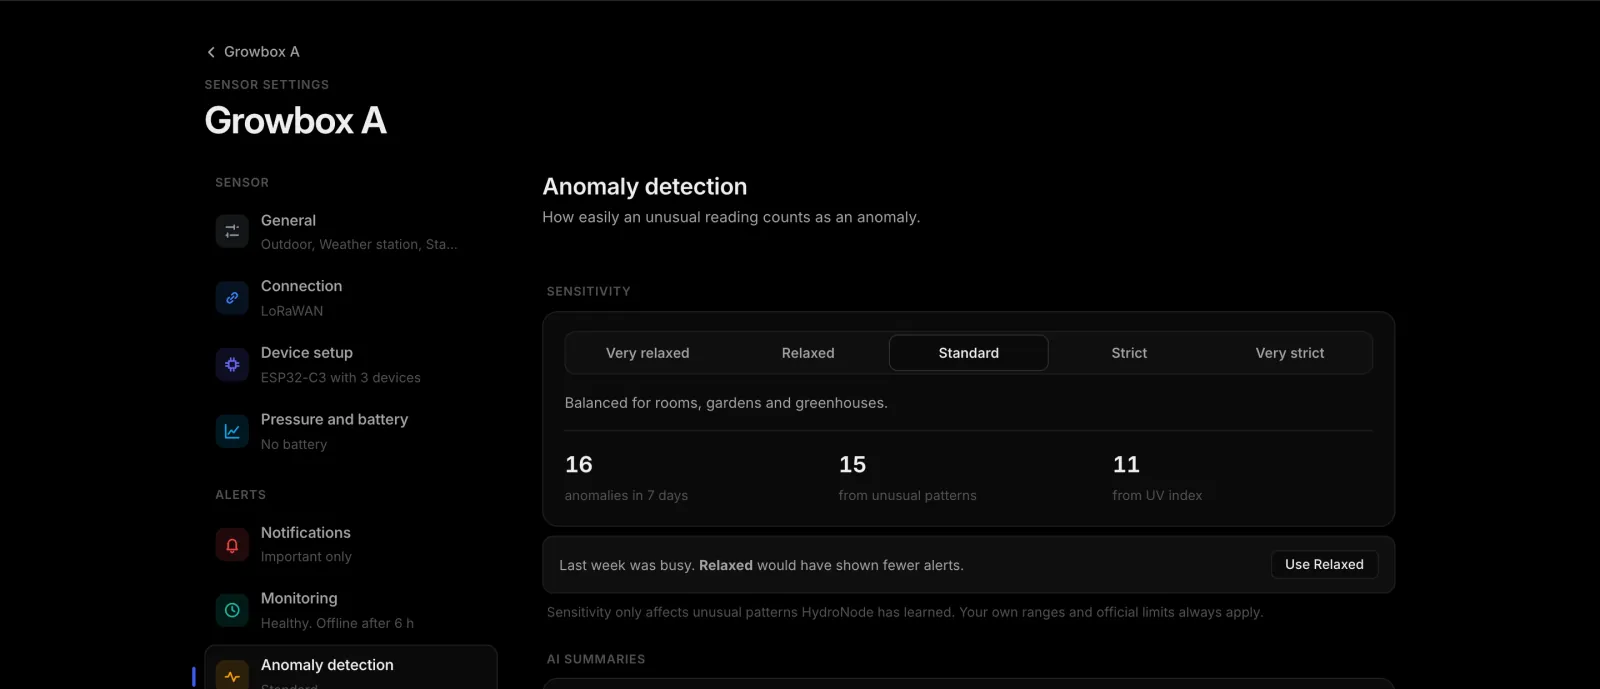
- Open the settingsOn the sensor page press Settings, then Anomaly detection on the left.
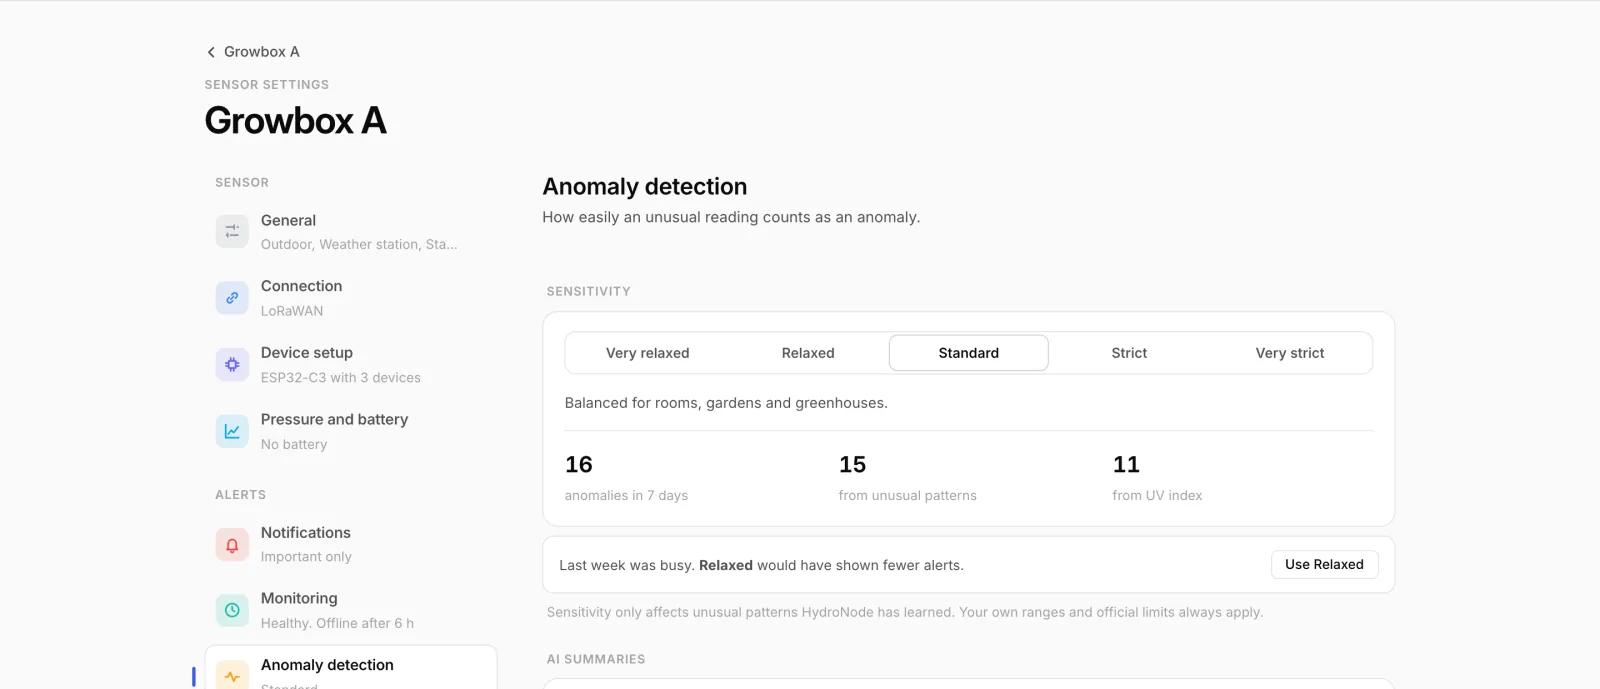
- Pick a levelFrom Very relaxed to Very strict. Below it you see how many anomalies the last seven days produced, and where they came from.
- Check the suggestionAfter a busy week HydroNode suggests a calmer level, for example Use Relaxed.
| Level | Band | Good for |
|---|---|---|
| Very relaxed | 2.0× | Only extreme outliers |
| Relaxed | 1.5× | Clear deviations only |
| Standard | 1.25× | The default, balanced for rooms and gardens |
| Strict | 1.0× | Smaller deviations too |
| Very strict | 0.8× | Every noticeable change |
Dial 2: your own targets
You know your tomatoes like 60 to 70 % humidity, or your nutrient solution needs a pH between 5.8 and 6.3? Then tell HydroNode.
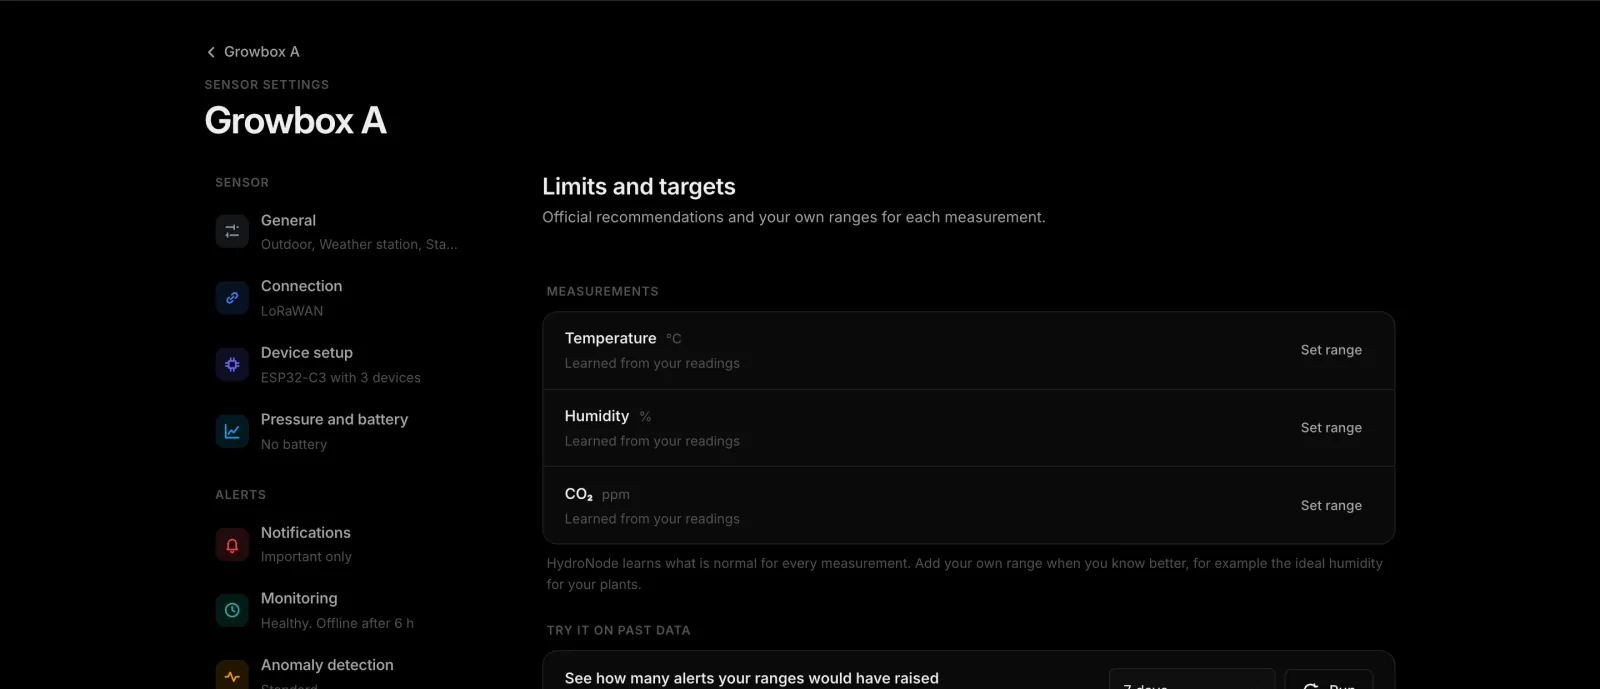
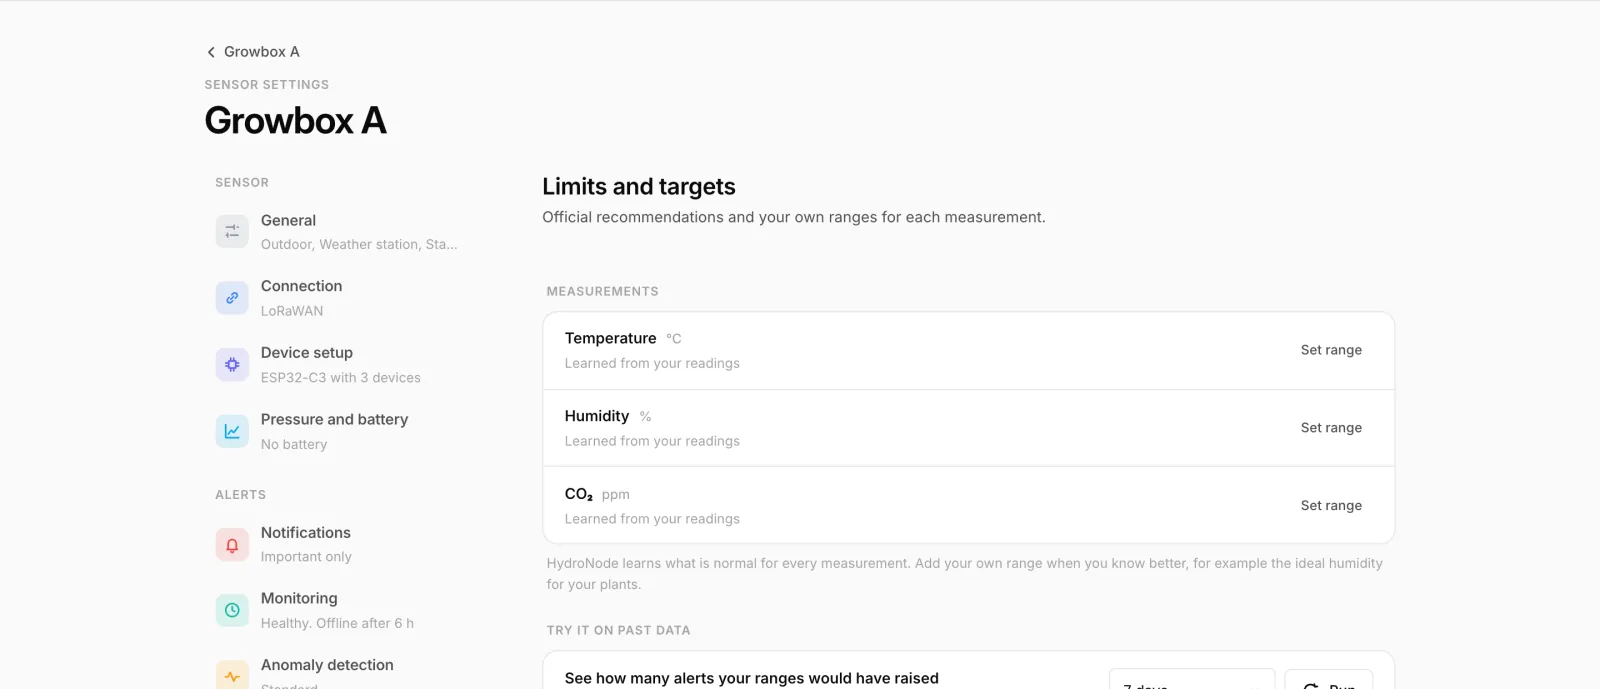
- Open the sectionSettingsLimits and targets
- Set the rangePress Set range next to the measurement and enter the minimum and maximum.
- Test it on the pastUnder Try it on past data HydroNode works out how many alerts your range would have raised over the last days. Nothing is sent and nothing changes.
Dial 3: what reaches your phone
Under SettingsNotifications you choose Off, Important only or Everything per sensor. The choice is yours alone and syncs to all your devices. The app still lists every event, and your automations keep running.
What the AI analysis adds
An AI analysis is a short written explanation of how a sensor is doing right now: a summary, up to six findings and up to three concrete next steps. It explains the result, it does not decide anything. Values, severities and incidents are calculated by HydroNode first with fixed rules, and the AI may not contradict them.
How many analyses you have left this month is shown under SettingsAnomaly detection next to AI summaries. Every detail is in the AI analysis docs.
Read more
- When instead of an odd value no value arrives at all: Know when a sensor goes quiet.
- React to anomalies in Home Assistant: HydroNode in Home Assistant.
- Every incident type and rule: anomaly detection docs.