 HydroNode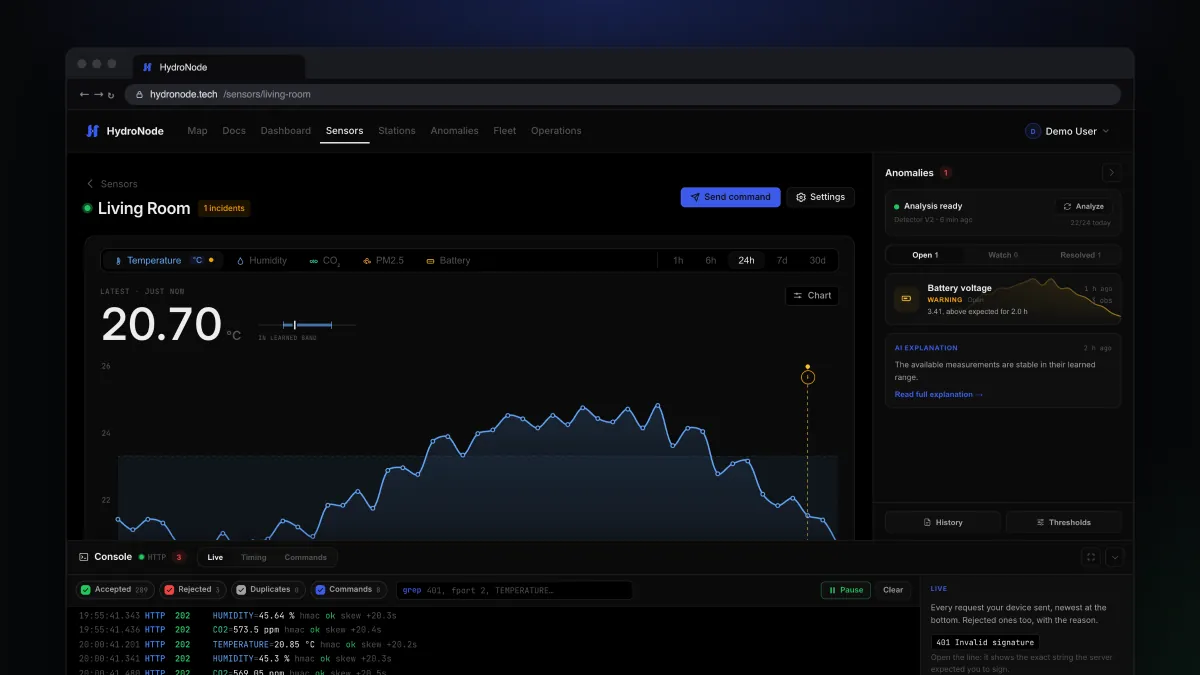
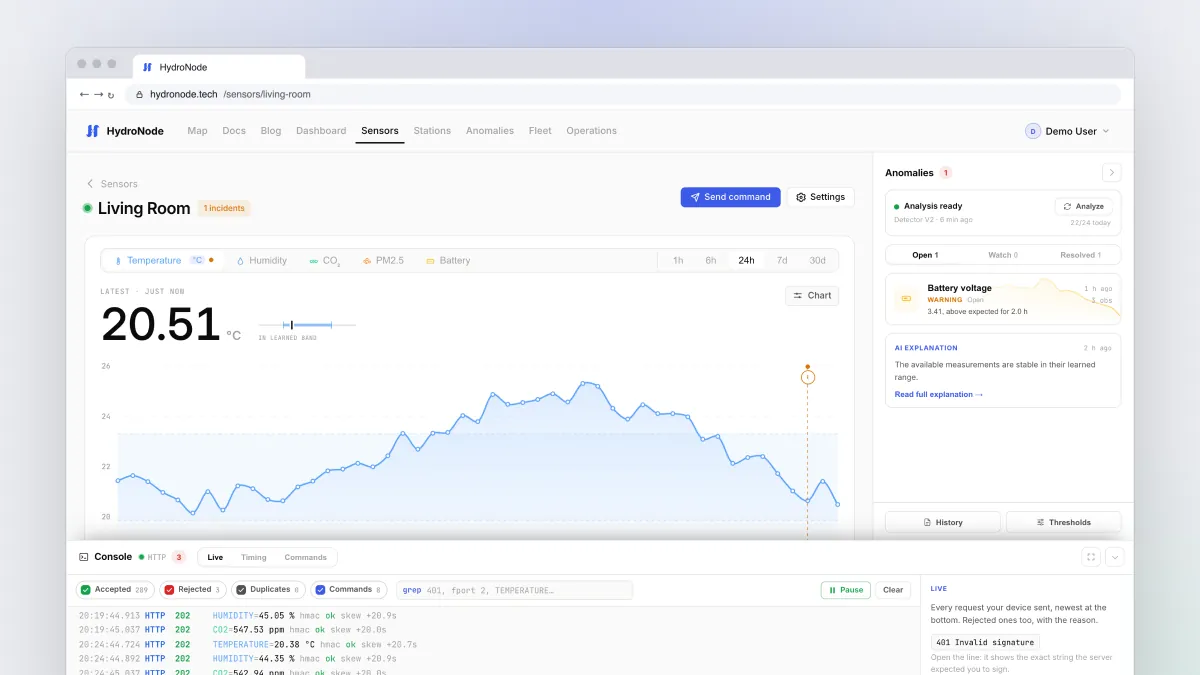
The device blinks, the serial monitor says sent, yet nothing happens on the chart. Instead of guessing, open the device console. It shows every request your device makes, including the rejected ones, and tells you exactly why.
Open the console
- Go to the sensor pageClick the sensor under Sensors.
- Open itClick the Console bar at the bottom or press `. Drag the top edge to resize it; the button on the right goes full screen.
- On your phoneIn the app, open the ⋯ menu at the top right of the sensor page and pick Console. It has Live, Timing and Commands.
Live: every request as it arrives
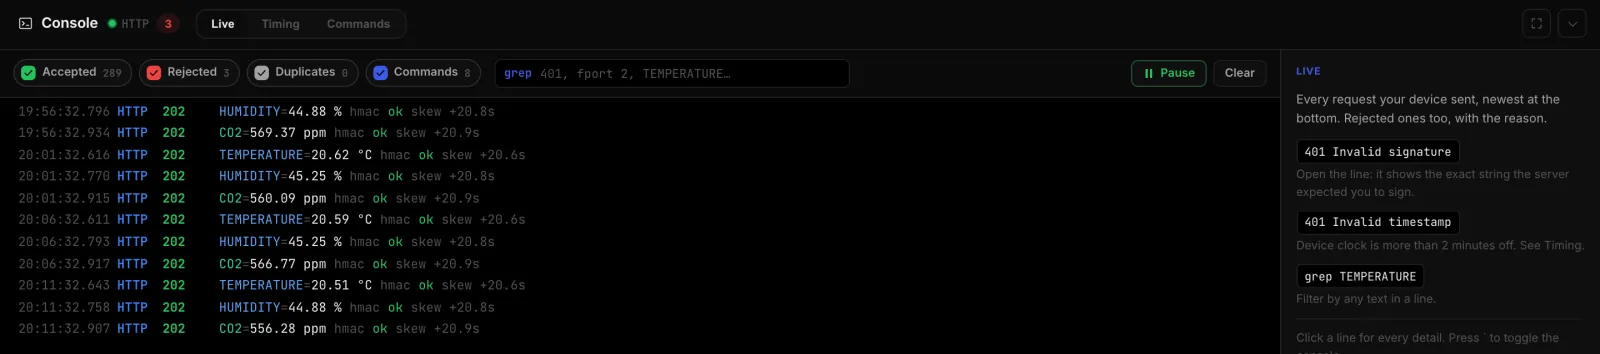
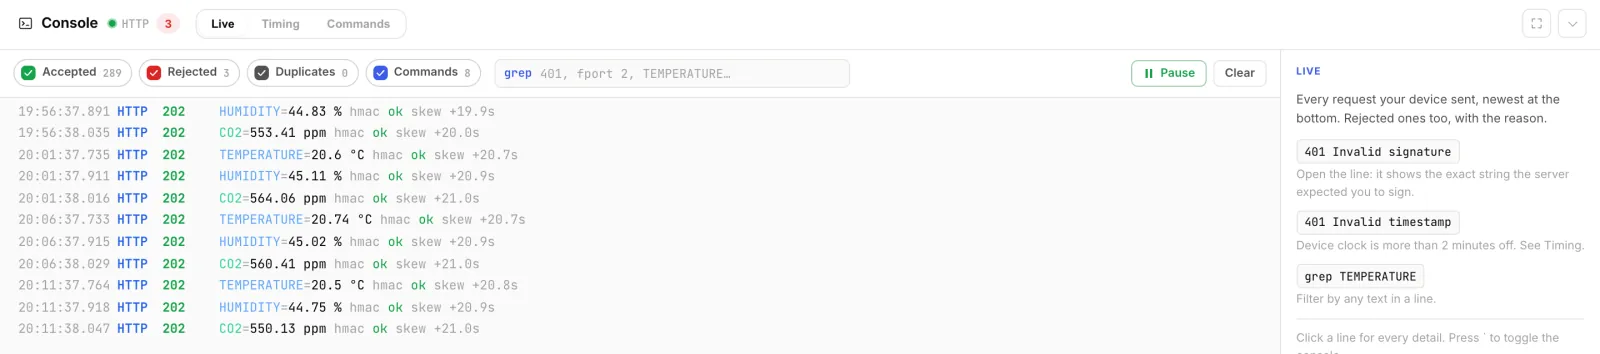
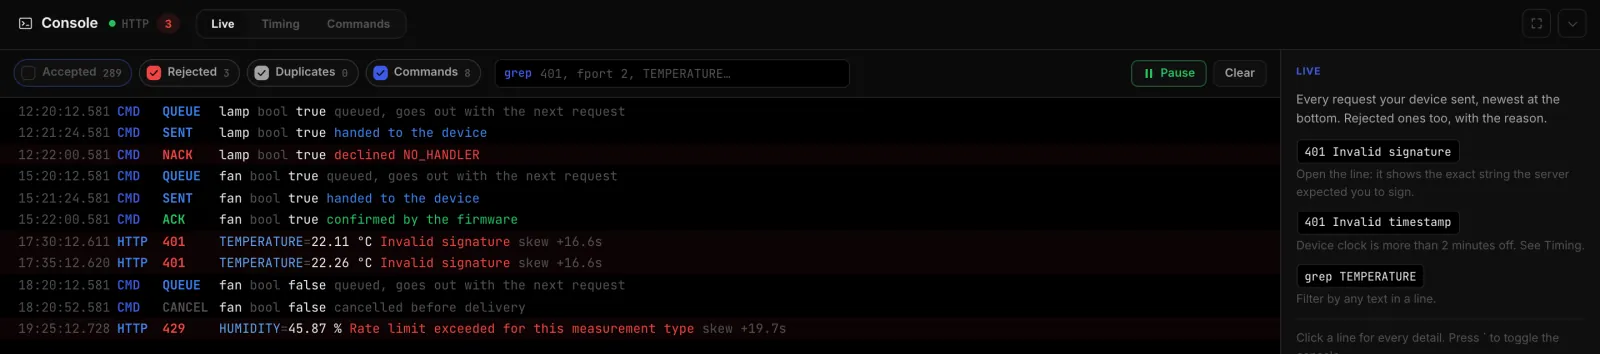
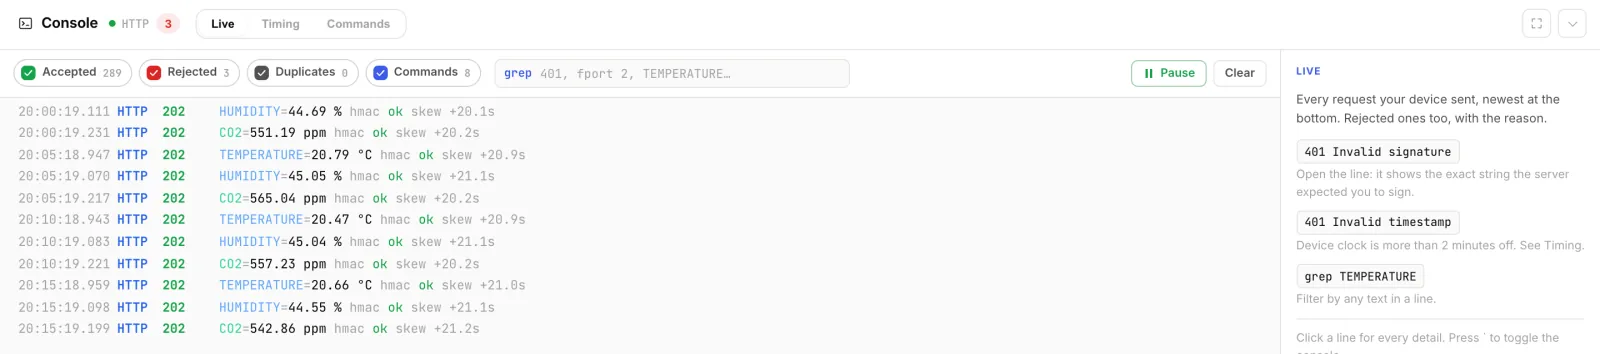
New lines appear at the bottom. An HTTP line shows the time, status, measurement and value, the result of the signature check (hmac ok) and how far the device clock is off (skew +20.1s). The toggles at the top show or hide accepted, rejected, duplicate and command lines, and grep filters by any text, such as 401 or TEMPERATURE.
Rejected: the usual reasons
Switch Accepted off and only the problem cases stay.
| Line | Cause | Fix |
|---|---|---|
| 401 Invalid signature | Wrong secret or wrongly signed text | Click the line: it shows the exact text the server expected you to sign. Compare the secret under SettingsConnection. |
| 401 Invalid timestamp | Device clock off by more than 2 minutes | Check the time sync. The Arduino library refreshes its time on its own after this answer. |
| 429 | Sent too fast | At most one value per measurement type every 10 seconds. |
| DUP | Repeated request | Harmless. The value was already stored and is not counted twice. |
| no fPort configuration | LoRaWAN port without a layout | Add an fPort layout under SettingsConnection. |
Timing: is the clock right, is the rhythm there?
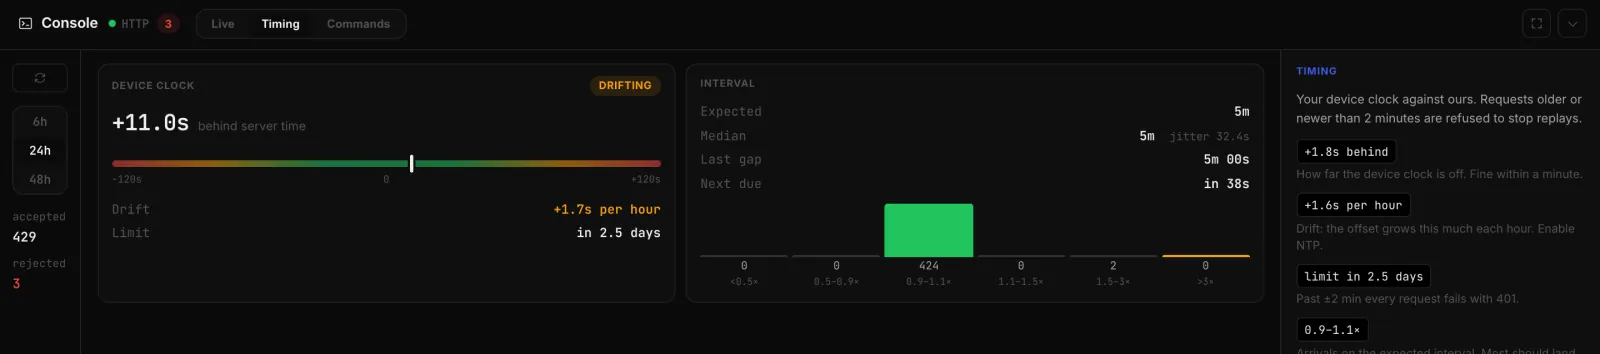
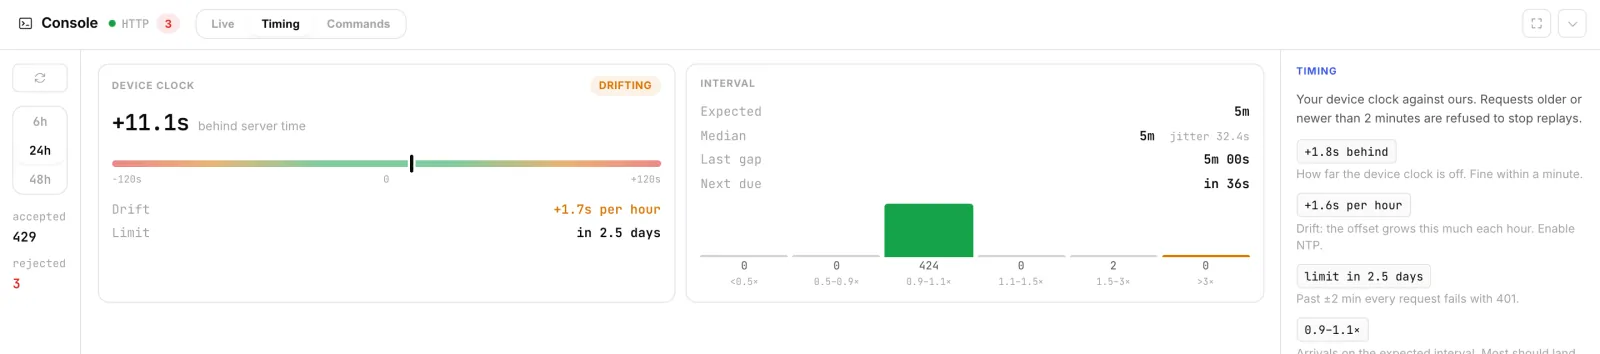
For HTTP sensors the Timing tab shows how far the device clock is off right now and how fast it drifts. Since requests more than two minutes off are refused, it works out when that limit would be reached. Next to it are the expected and typical interval, the last gap and a countdown to the next reading. LoRaWAN sensors get the Link tab instead, with RSSI, SNR and the last 100 frames.
Commands: from the prompt
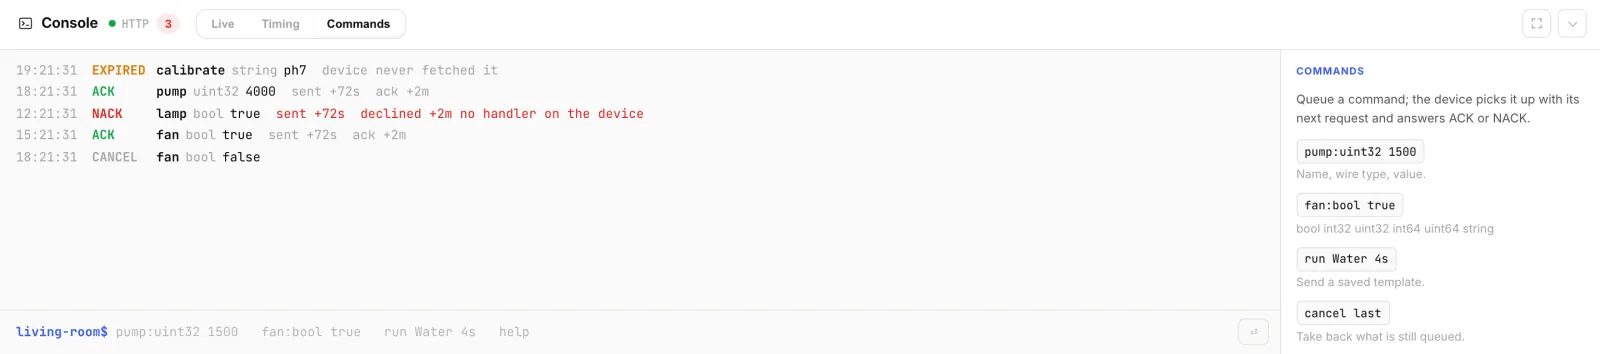
In the Commands tab you type commands like in a terminal. A command is queued and picked up with the device's next request. The device answers with acknowledged or declines with a reason. Tab completes names, ↑ brings back earlier commands.
pump:uint32 1500     # name, type, value
fan:bool true
run Water 4s         # send a saved command template
cancel last          # take back what is still queued
help                 # every command with examples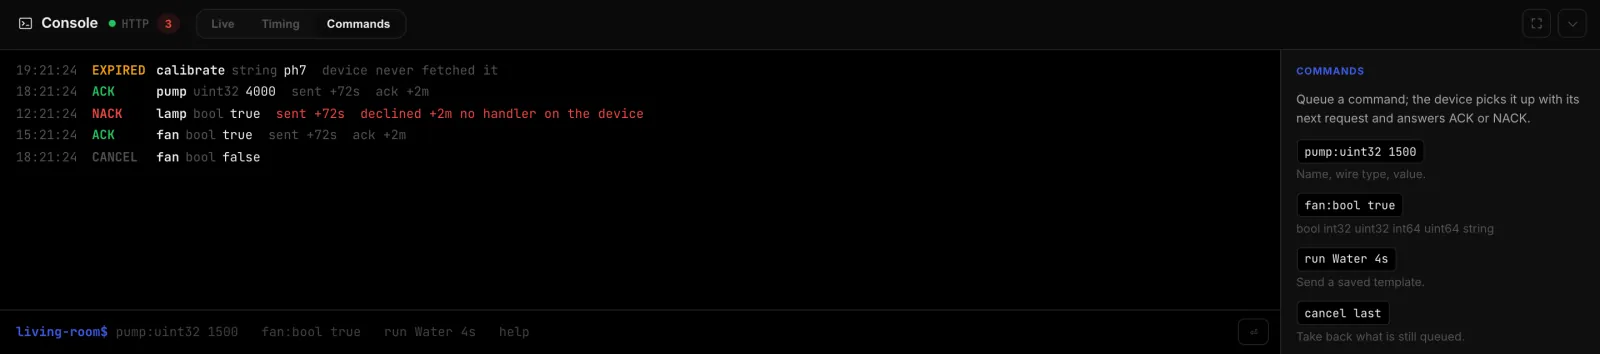
The checklist when nothing arrives
- No line in the console at all? The request never reaches HydroNode. Check WiFi, DNS and firewall. Is the right Sensor ID on the device?
- Only red lines? Read the reason in the line, then the table above.
- Green lines but an empty chart? Pick the right measurement at the top of the chart. A mistyped type name lands as a channel of its own.
- Values arrive, but too rarely? Look at the typical interval in the Timing tab, then tune monitoring to match.
Read more
- Start from scratch with the library: Your first ESP32 sensor.
- Every tab, including the decoder and payload builder: console docs.