Operations
The tools around your devices: automations that act on their own, calibration against a reference, reports, export and import, and one list of every job that ran on their behalf. Open Operations in the top navigation.
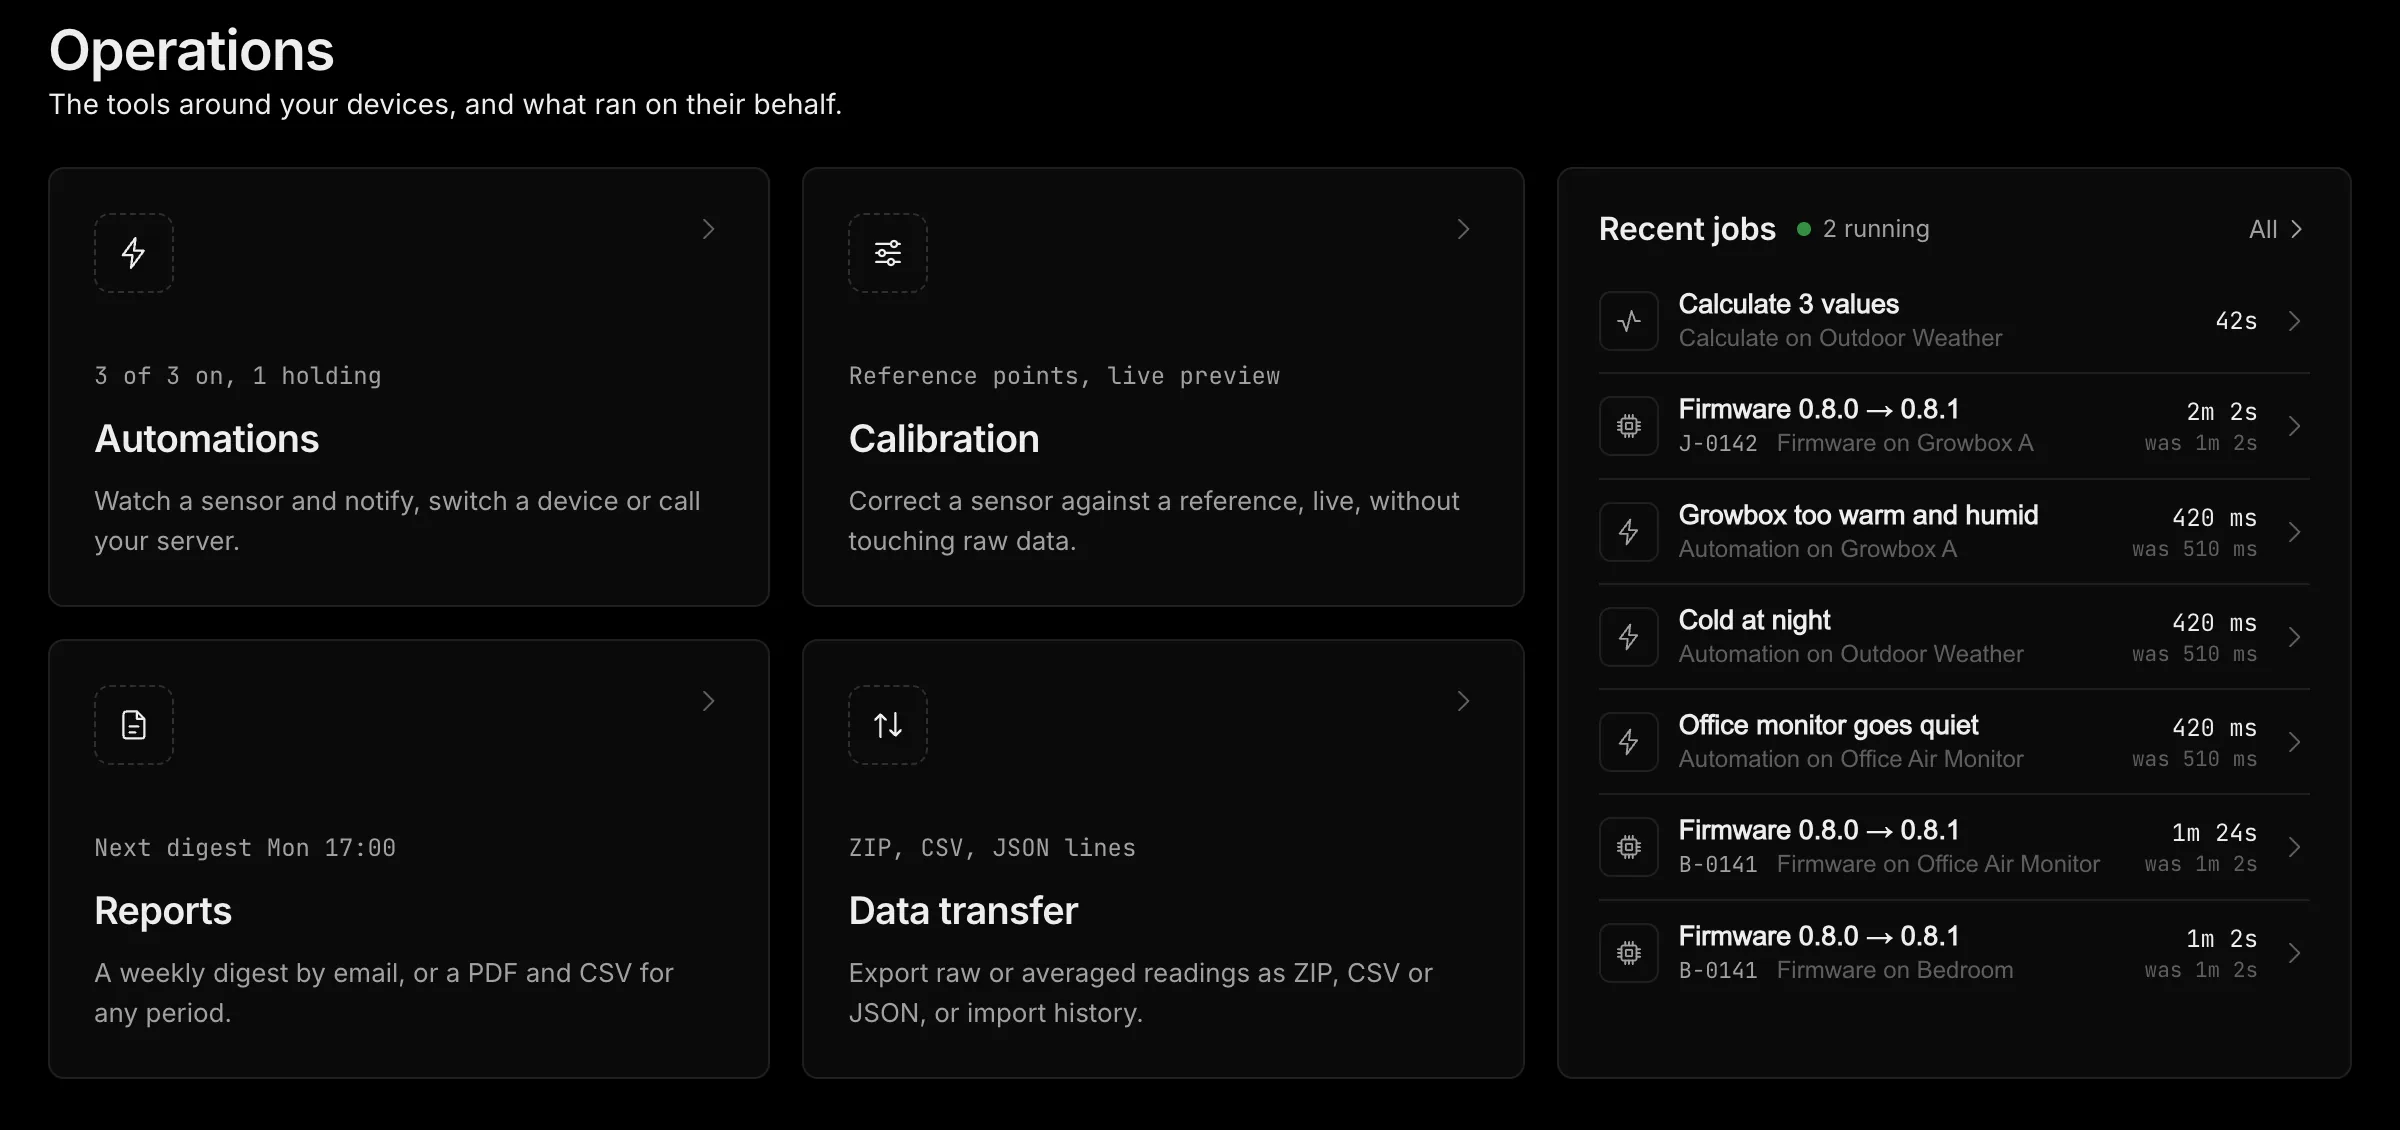
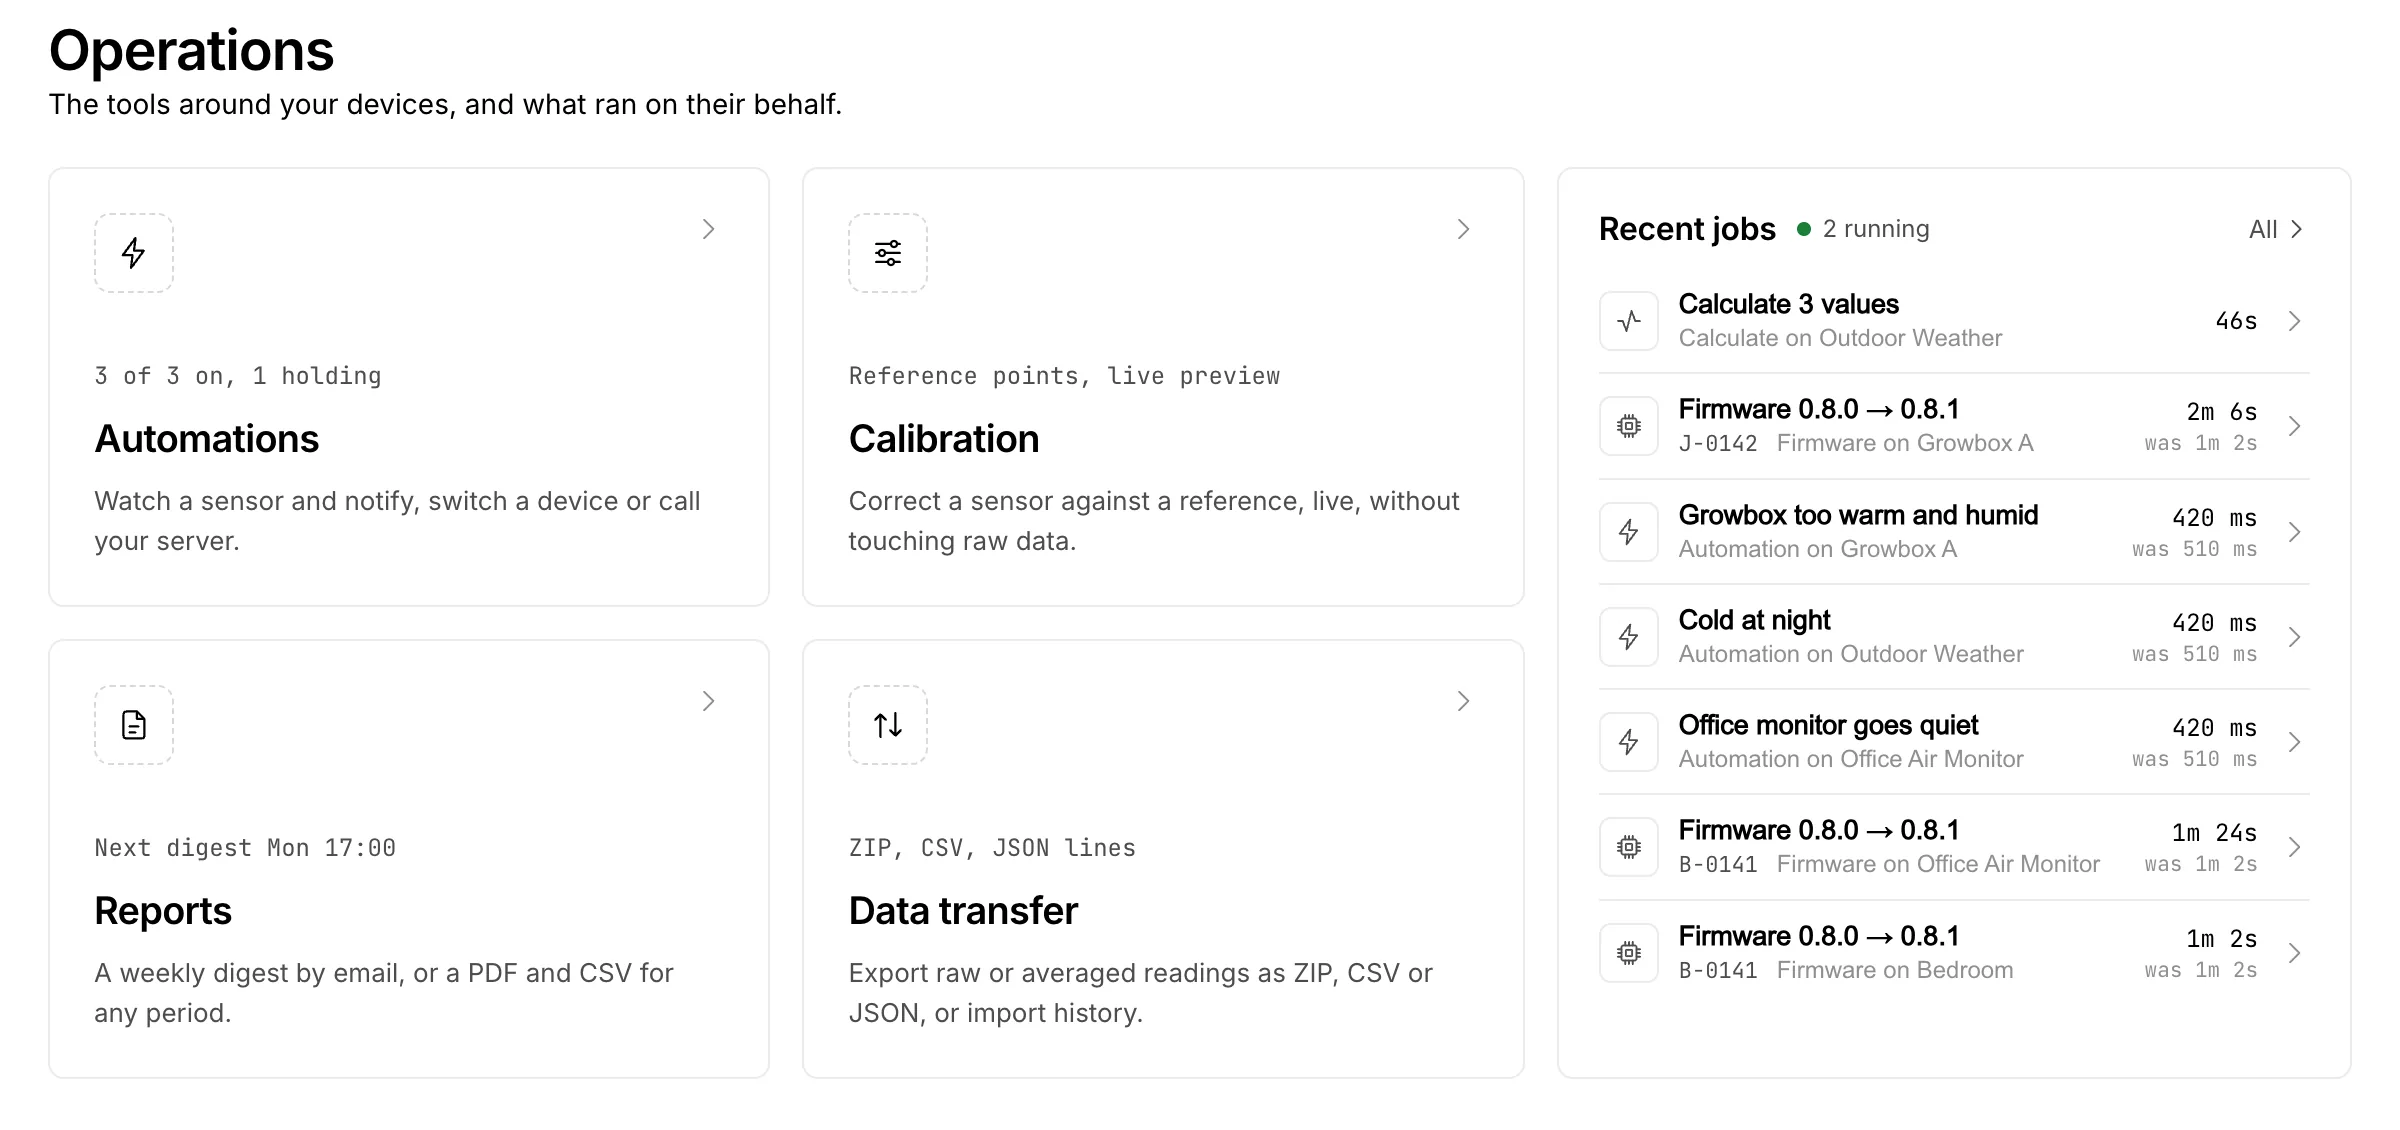
Four tools and the recent jobs
Each card shows its state at a glance: how many rules are on and holding, when the next weekly report goes out. Recent jobs on the right lists what is running and what ran last; All opens the full list.
Rules that act on their own
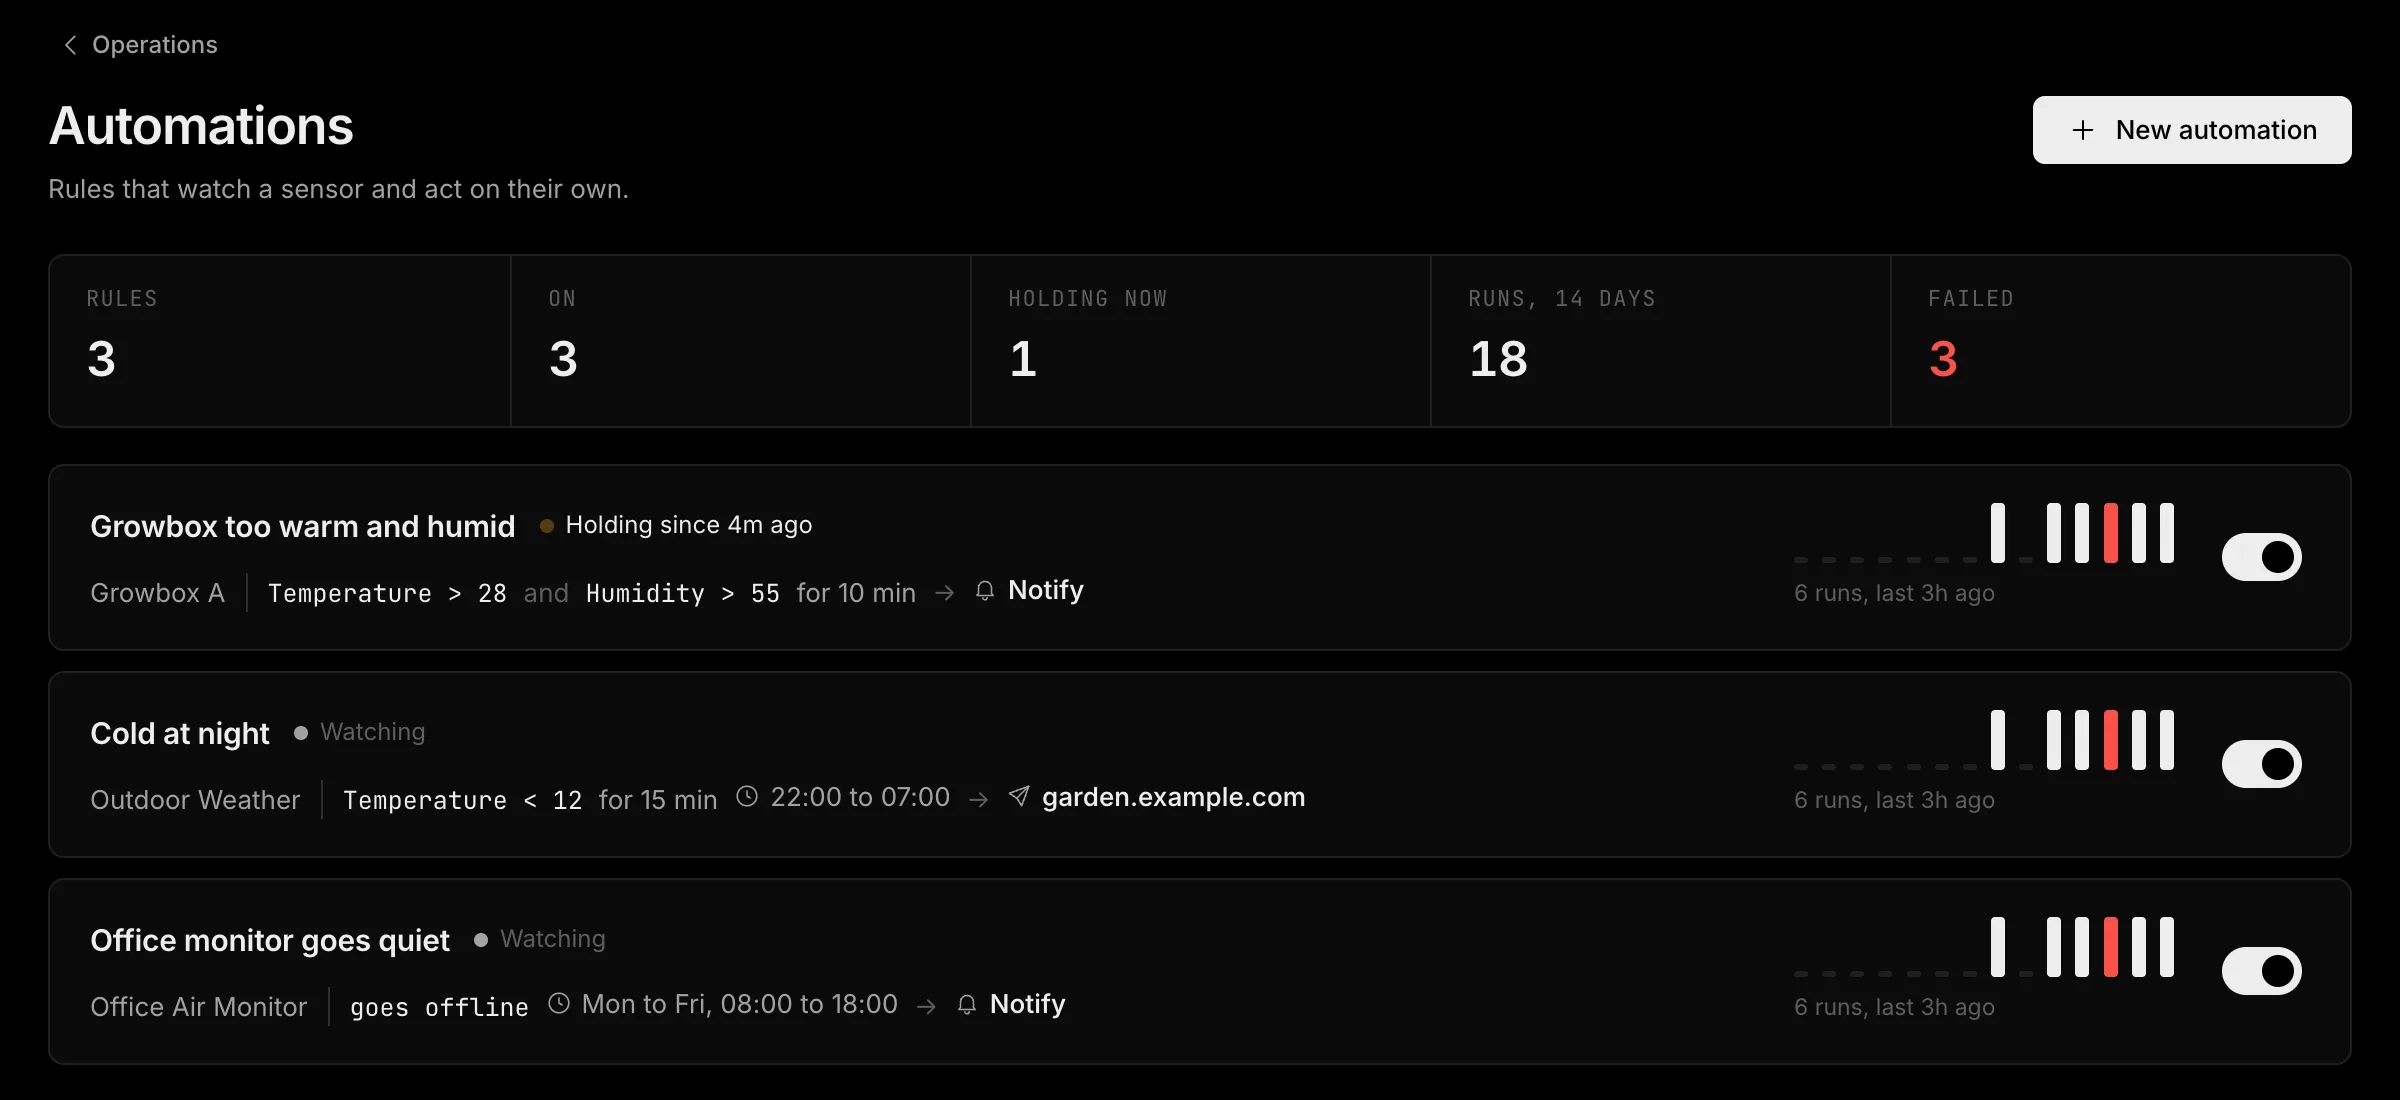
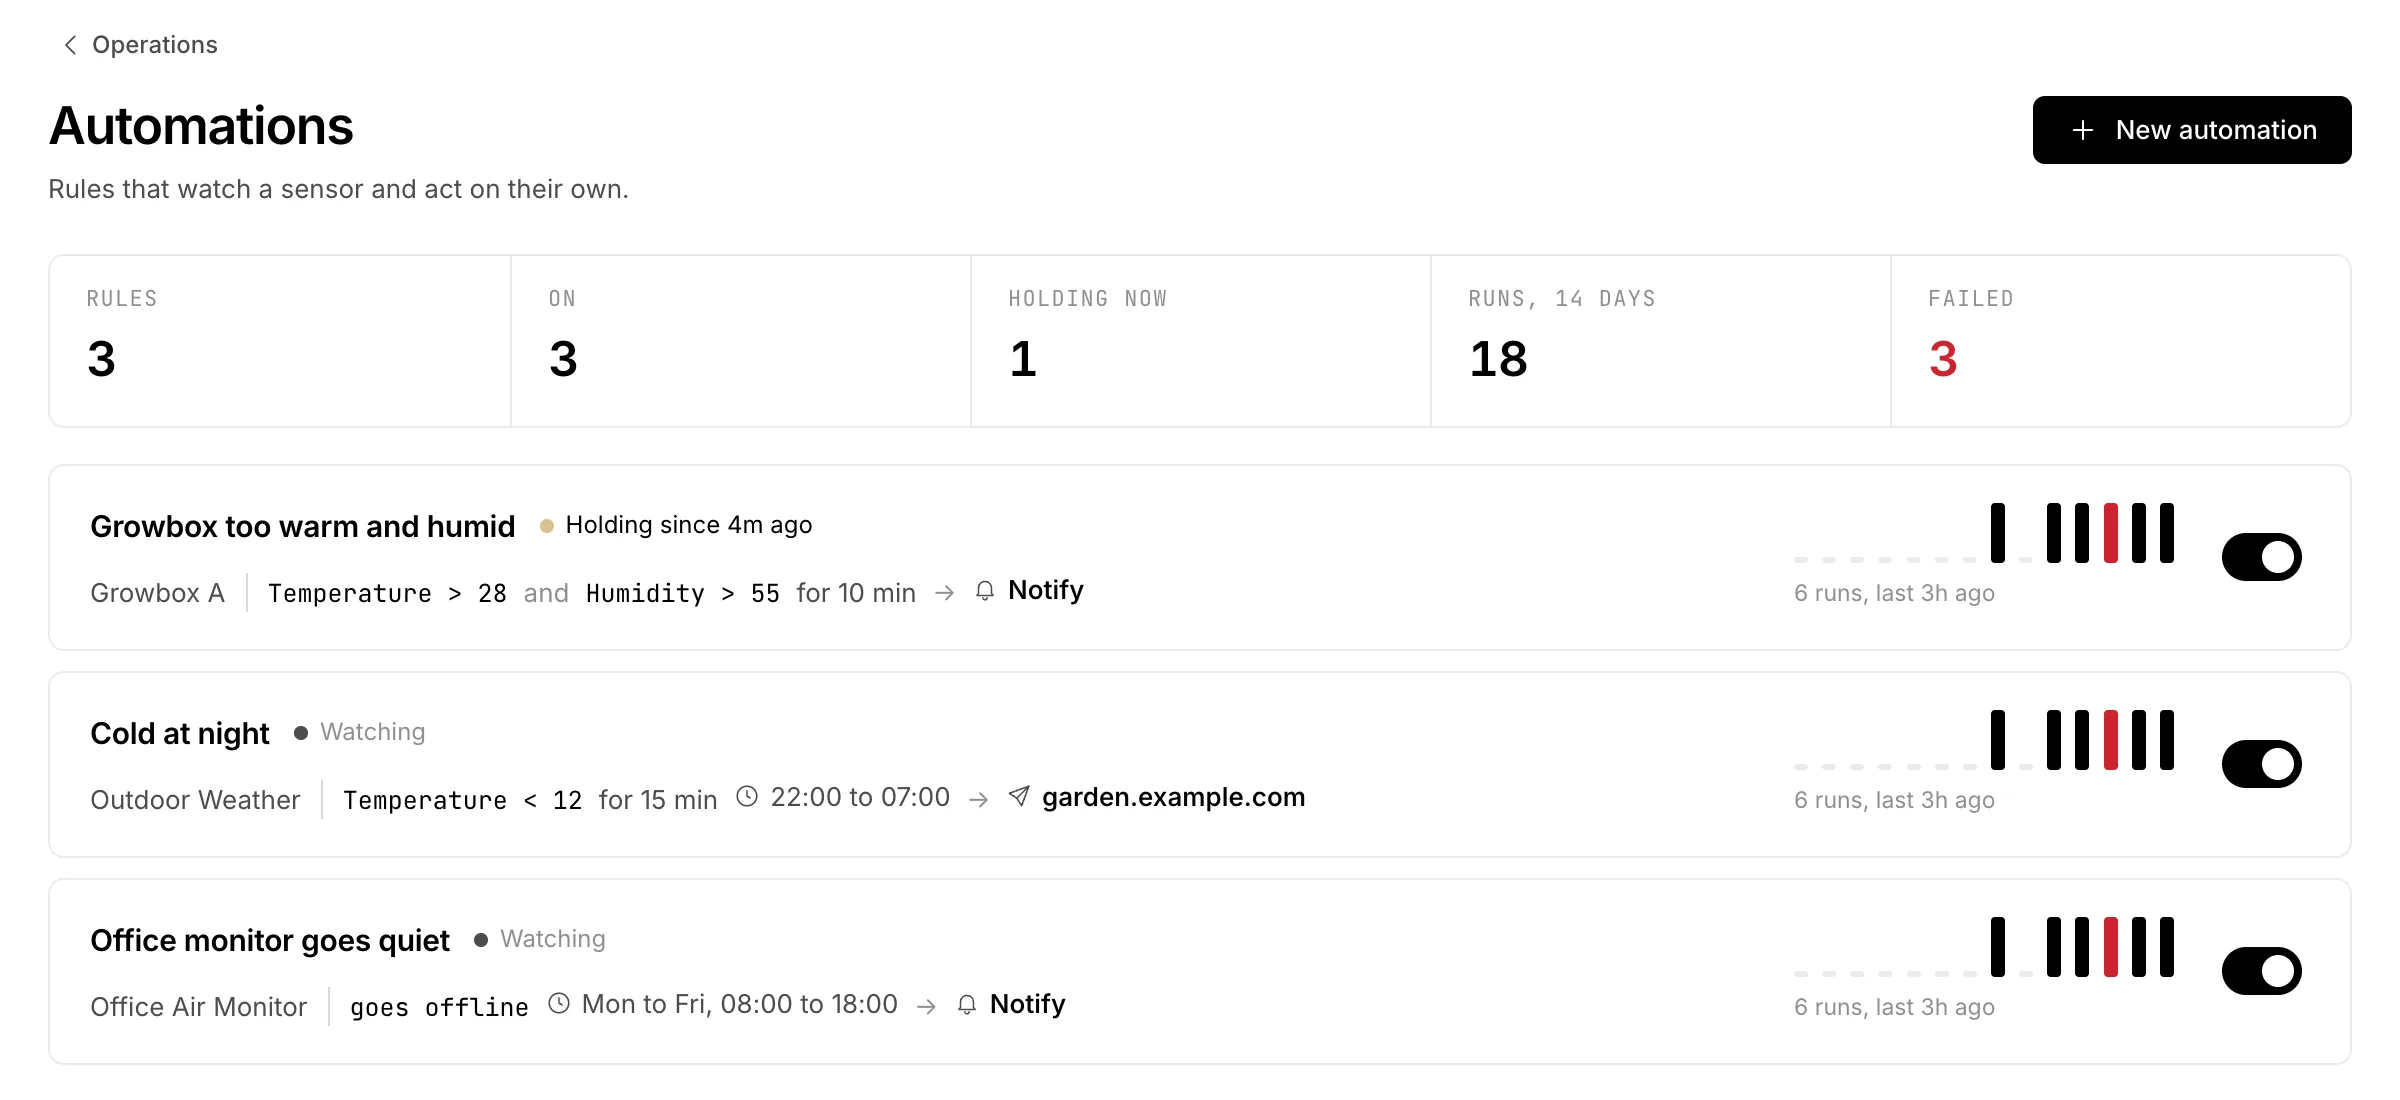
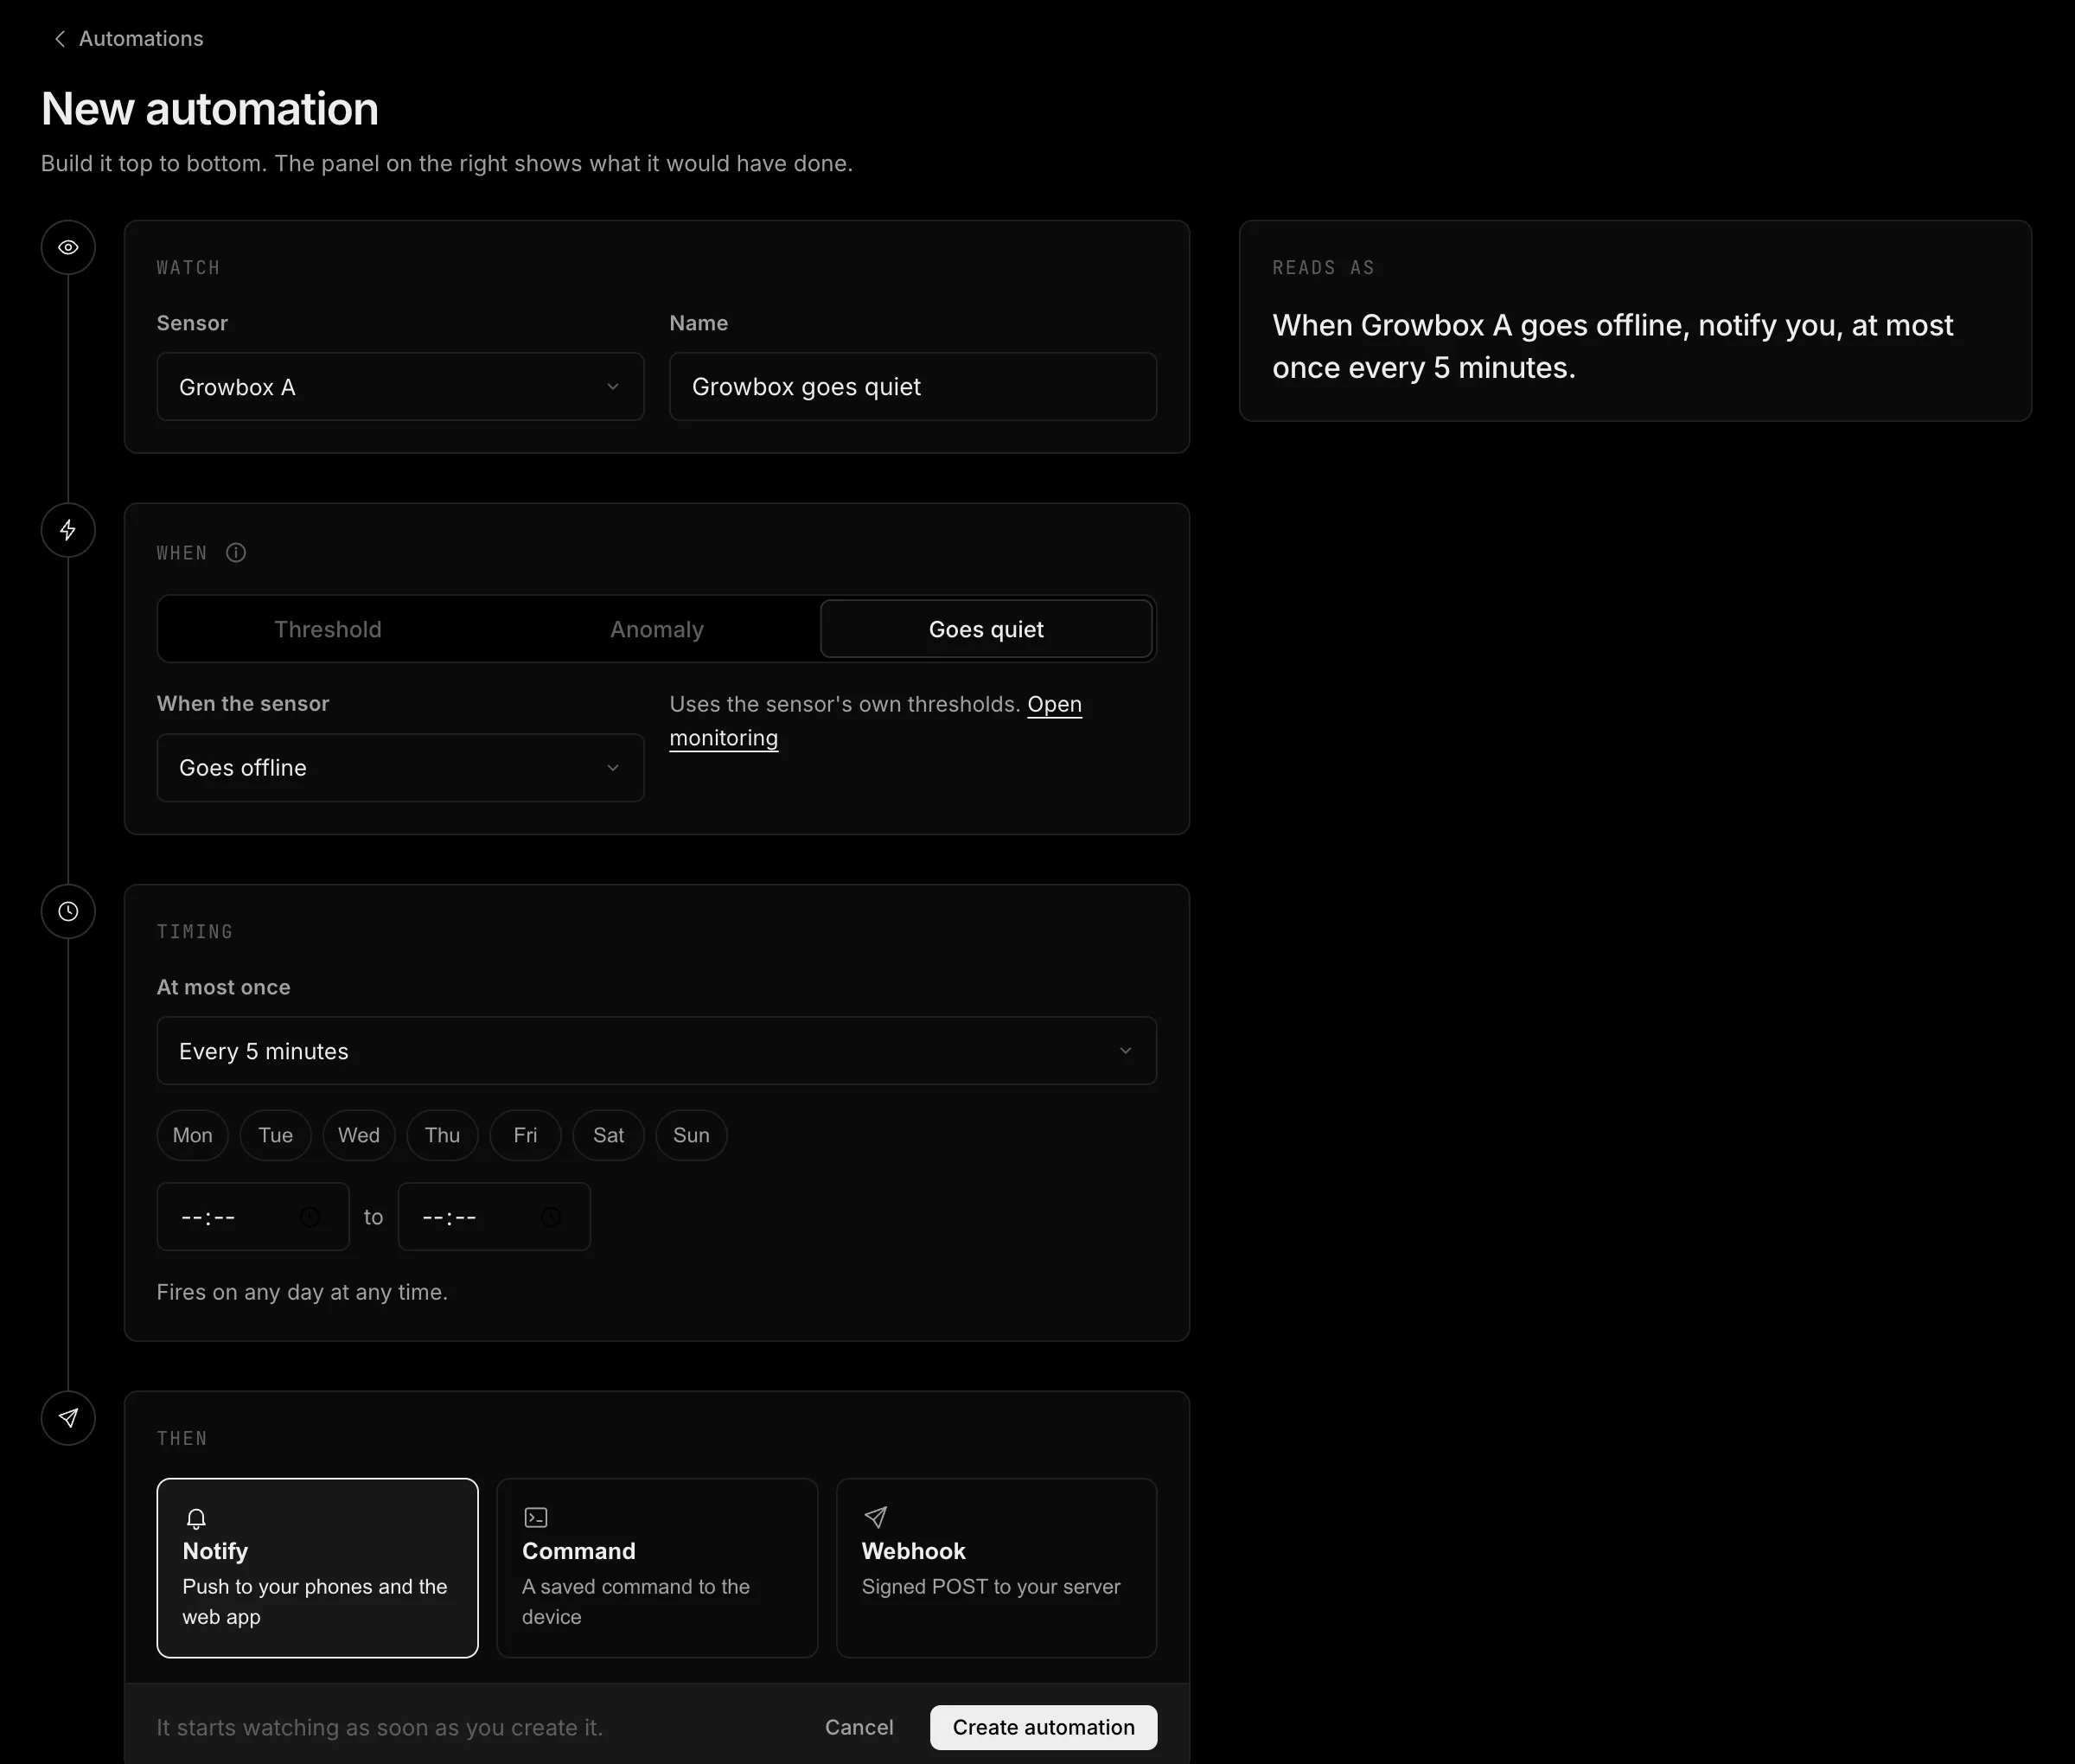
A rule watches one sensor and does something when a condition is met: it notifies you, sends a command to the device or calls your own server. The list shows every rule with its condition, whether it is Watching or Holding right now, its runs of the last 14 days and a switch to pause it.
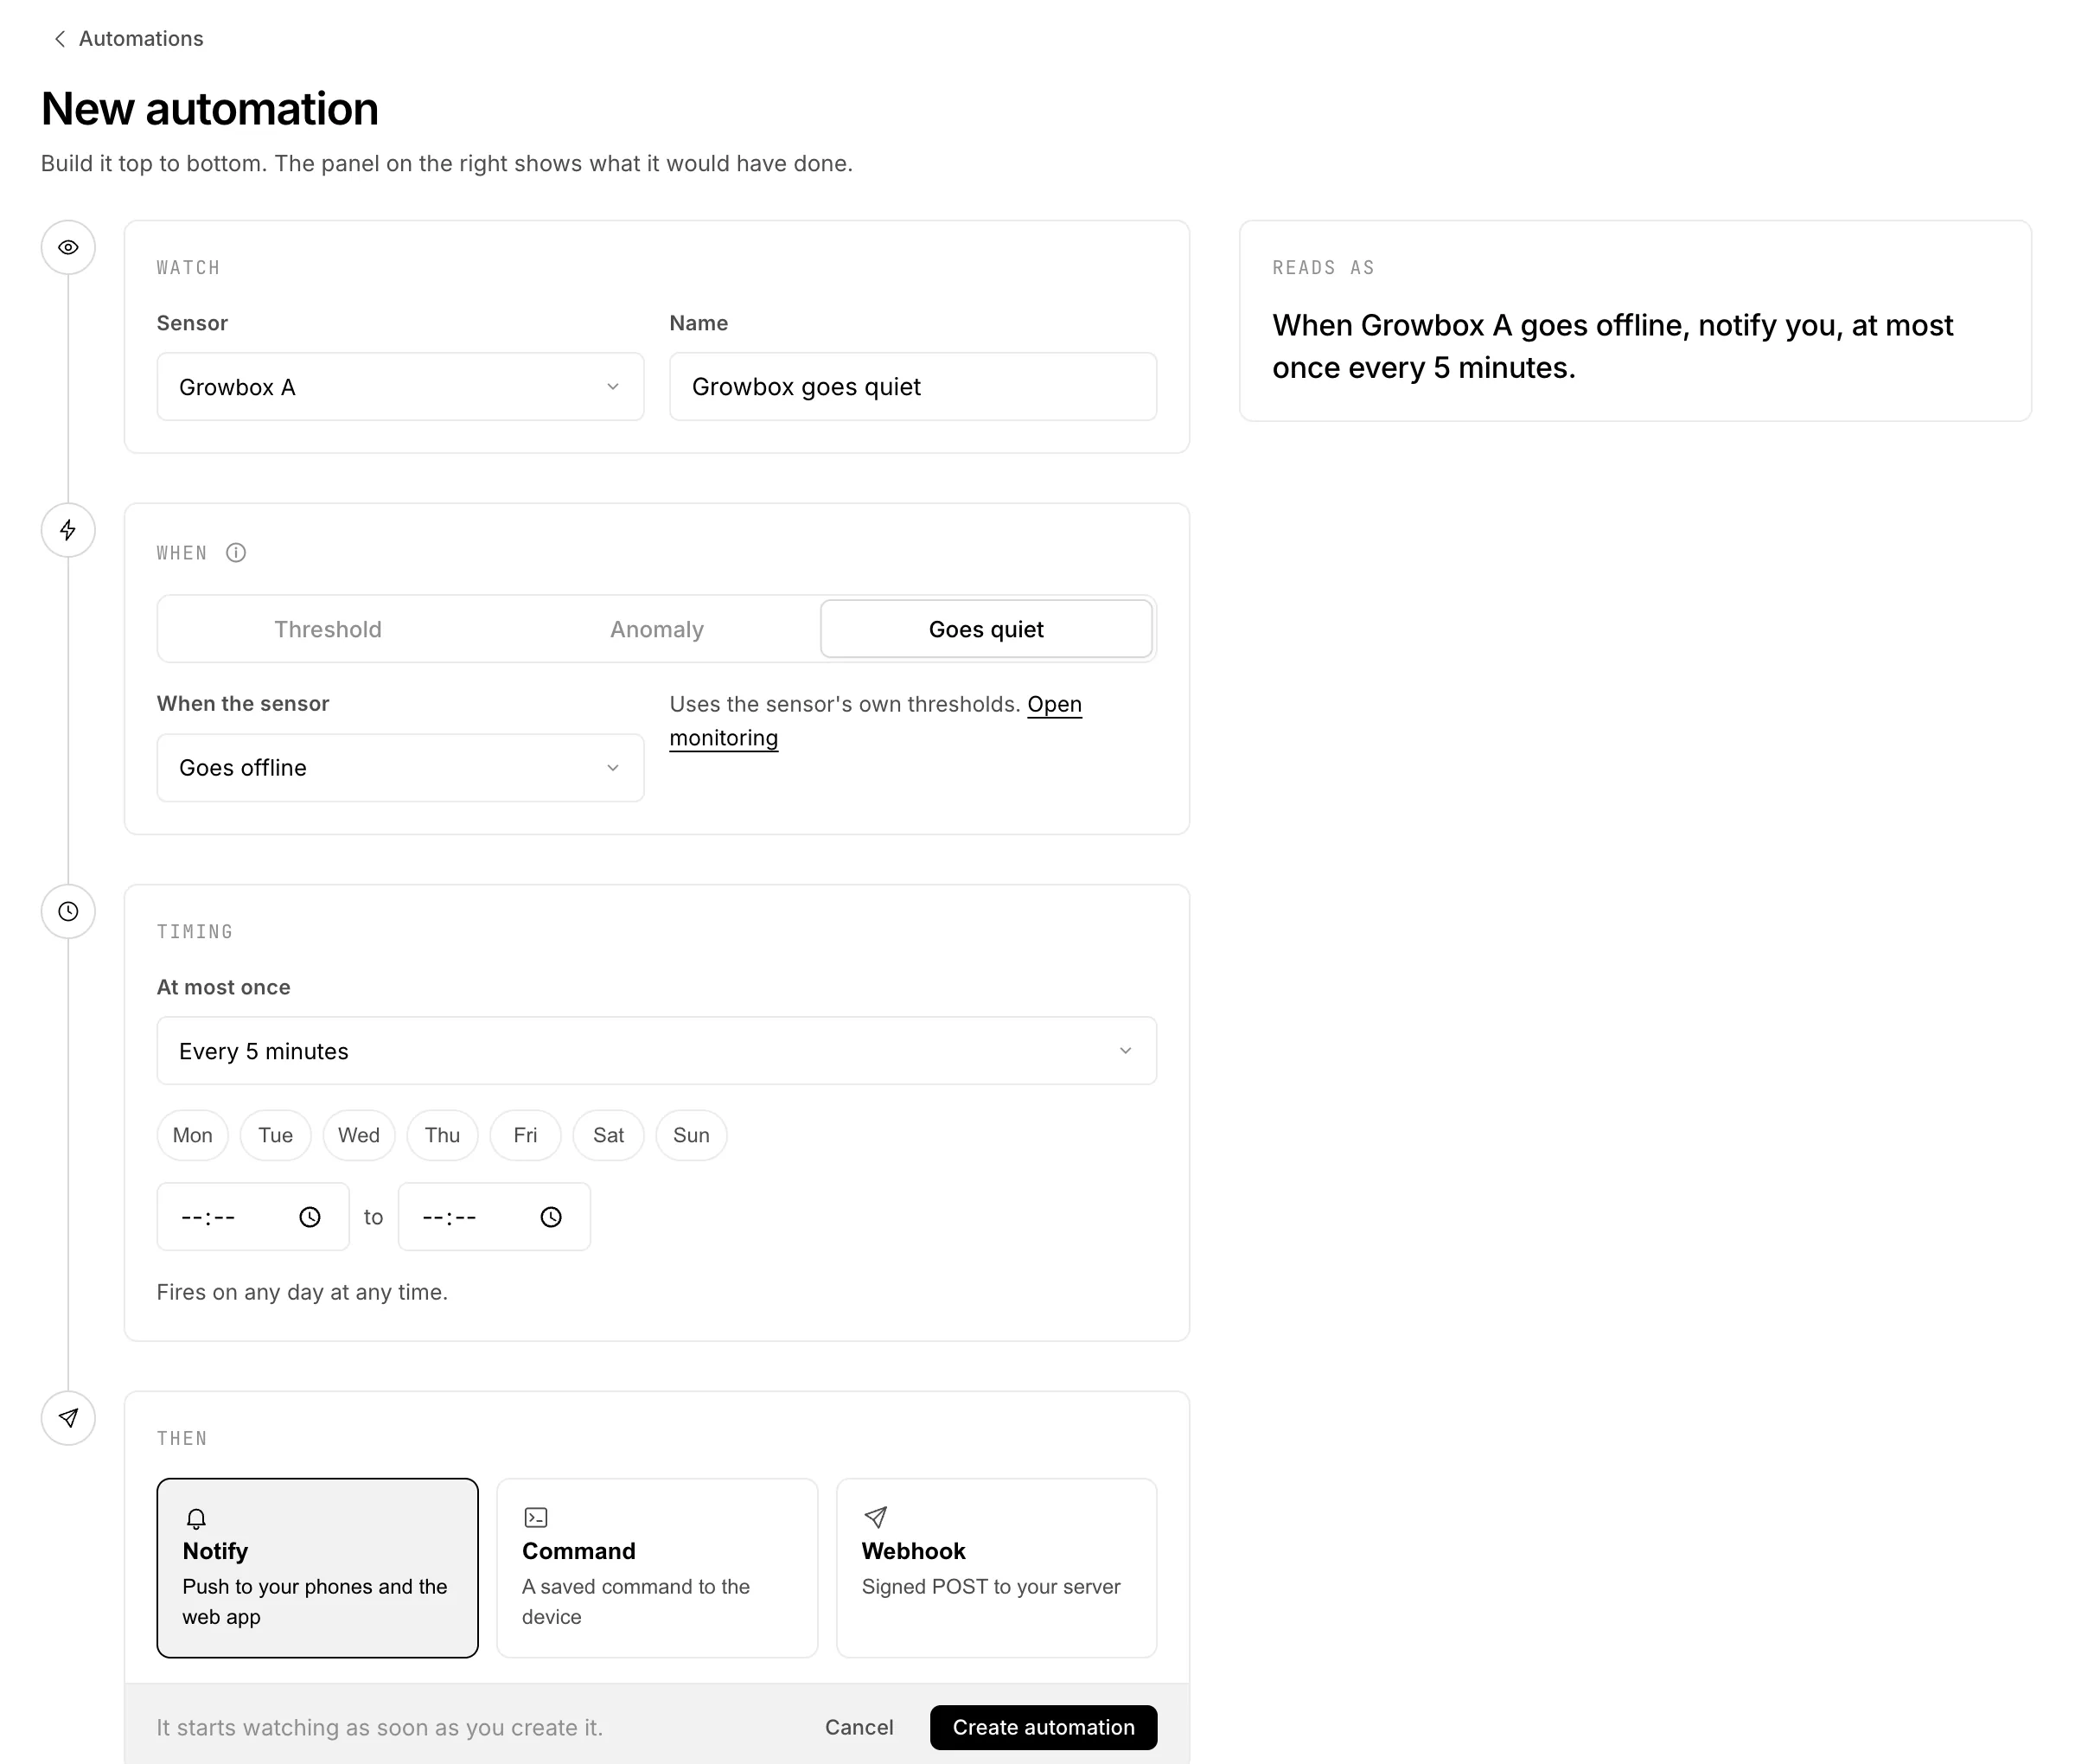
- 1WatchPress New automation, pick the sensor and give the rule a name. It appears in notifications and in the webhook.
- 2WhenThreshold, Anomaly or Goes quiet, see the table below. A threshold rule takes up to three conditions on the sensor's values, which must all hold, for example temperature above 28 and humidity above 55.
- 3TimingMust hold waits until the condition has held for 5 minutes up to an hour. Fires either Once until it clears or On every reading. At most once sets the shortest gap between two runs. Days and a time window limit when it may fire.
- 4ThenNotify sends a push to your phones and the web app. Command sends a saved command to the device. Webhook sends a signed POST to your HTTPS server.
- 5Check it before you create itReads as on the right puts the rule into one sentence. Last 30 days replays the sensor's history and shows how often the rule would have fired, with a tick under the chart for each run. Then press Create automation; it starts watching at once.
| When | Fires |
|---|---|
| Threshold | A value rises above or falls below a number. Checked on every new reading. |
| Anomaly | HydroNode's anomaly detection confirms a spike, drop or drift on the sensor. |
| Goes quiet | The sensor is delayed, goes offline or is back online, as Sensor Monitoring decides. |
- Clears below next to a threshold is a small band: a rule above 28 °C that clears below 27.5 °C does not flip on and off while the value hovers at 28.
- Values are compared as the charts show them, with unit, calibration and pressure at sea level applied.
- Readings a device stored and sent more than 5 minutes later never fire a rule. A pump should not switch for something that happened an hour ago.
- Every run is listed under the rule and in Jobs, with each action and its result.
Webhook. When you create the rule, HydroNode shows a signing secret once. Every request carries these headers; check the signature over the raw body with the secret before you trust it.
X-HydroNode-Delivery: <uuid, unique per attempt>
X-HydroNode-Timestamp: <ISO-8601 UTC>
X-HydroNode-Signature-256: sha256=<hex HMAC-SHA256 of the raw body>
Correct a sensor against a reference
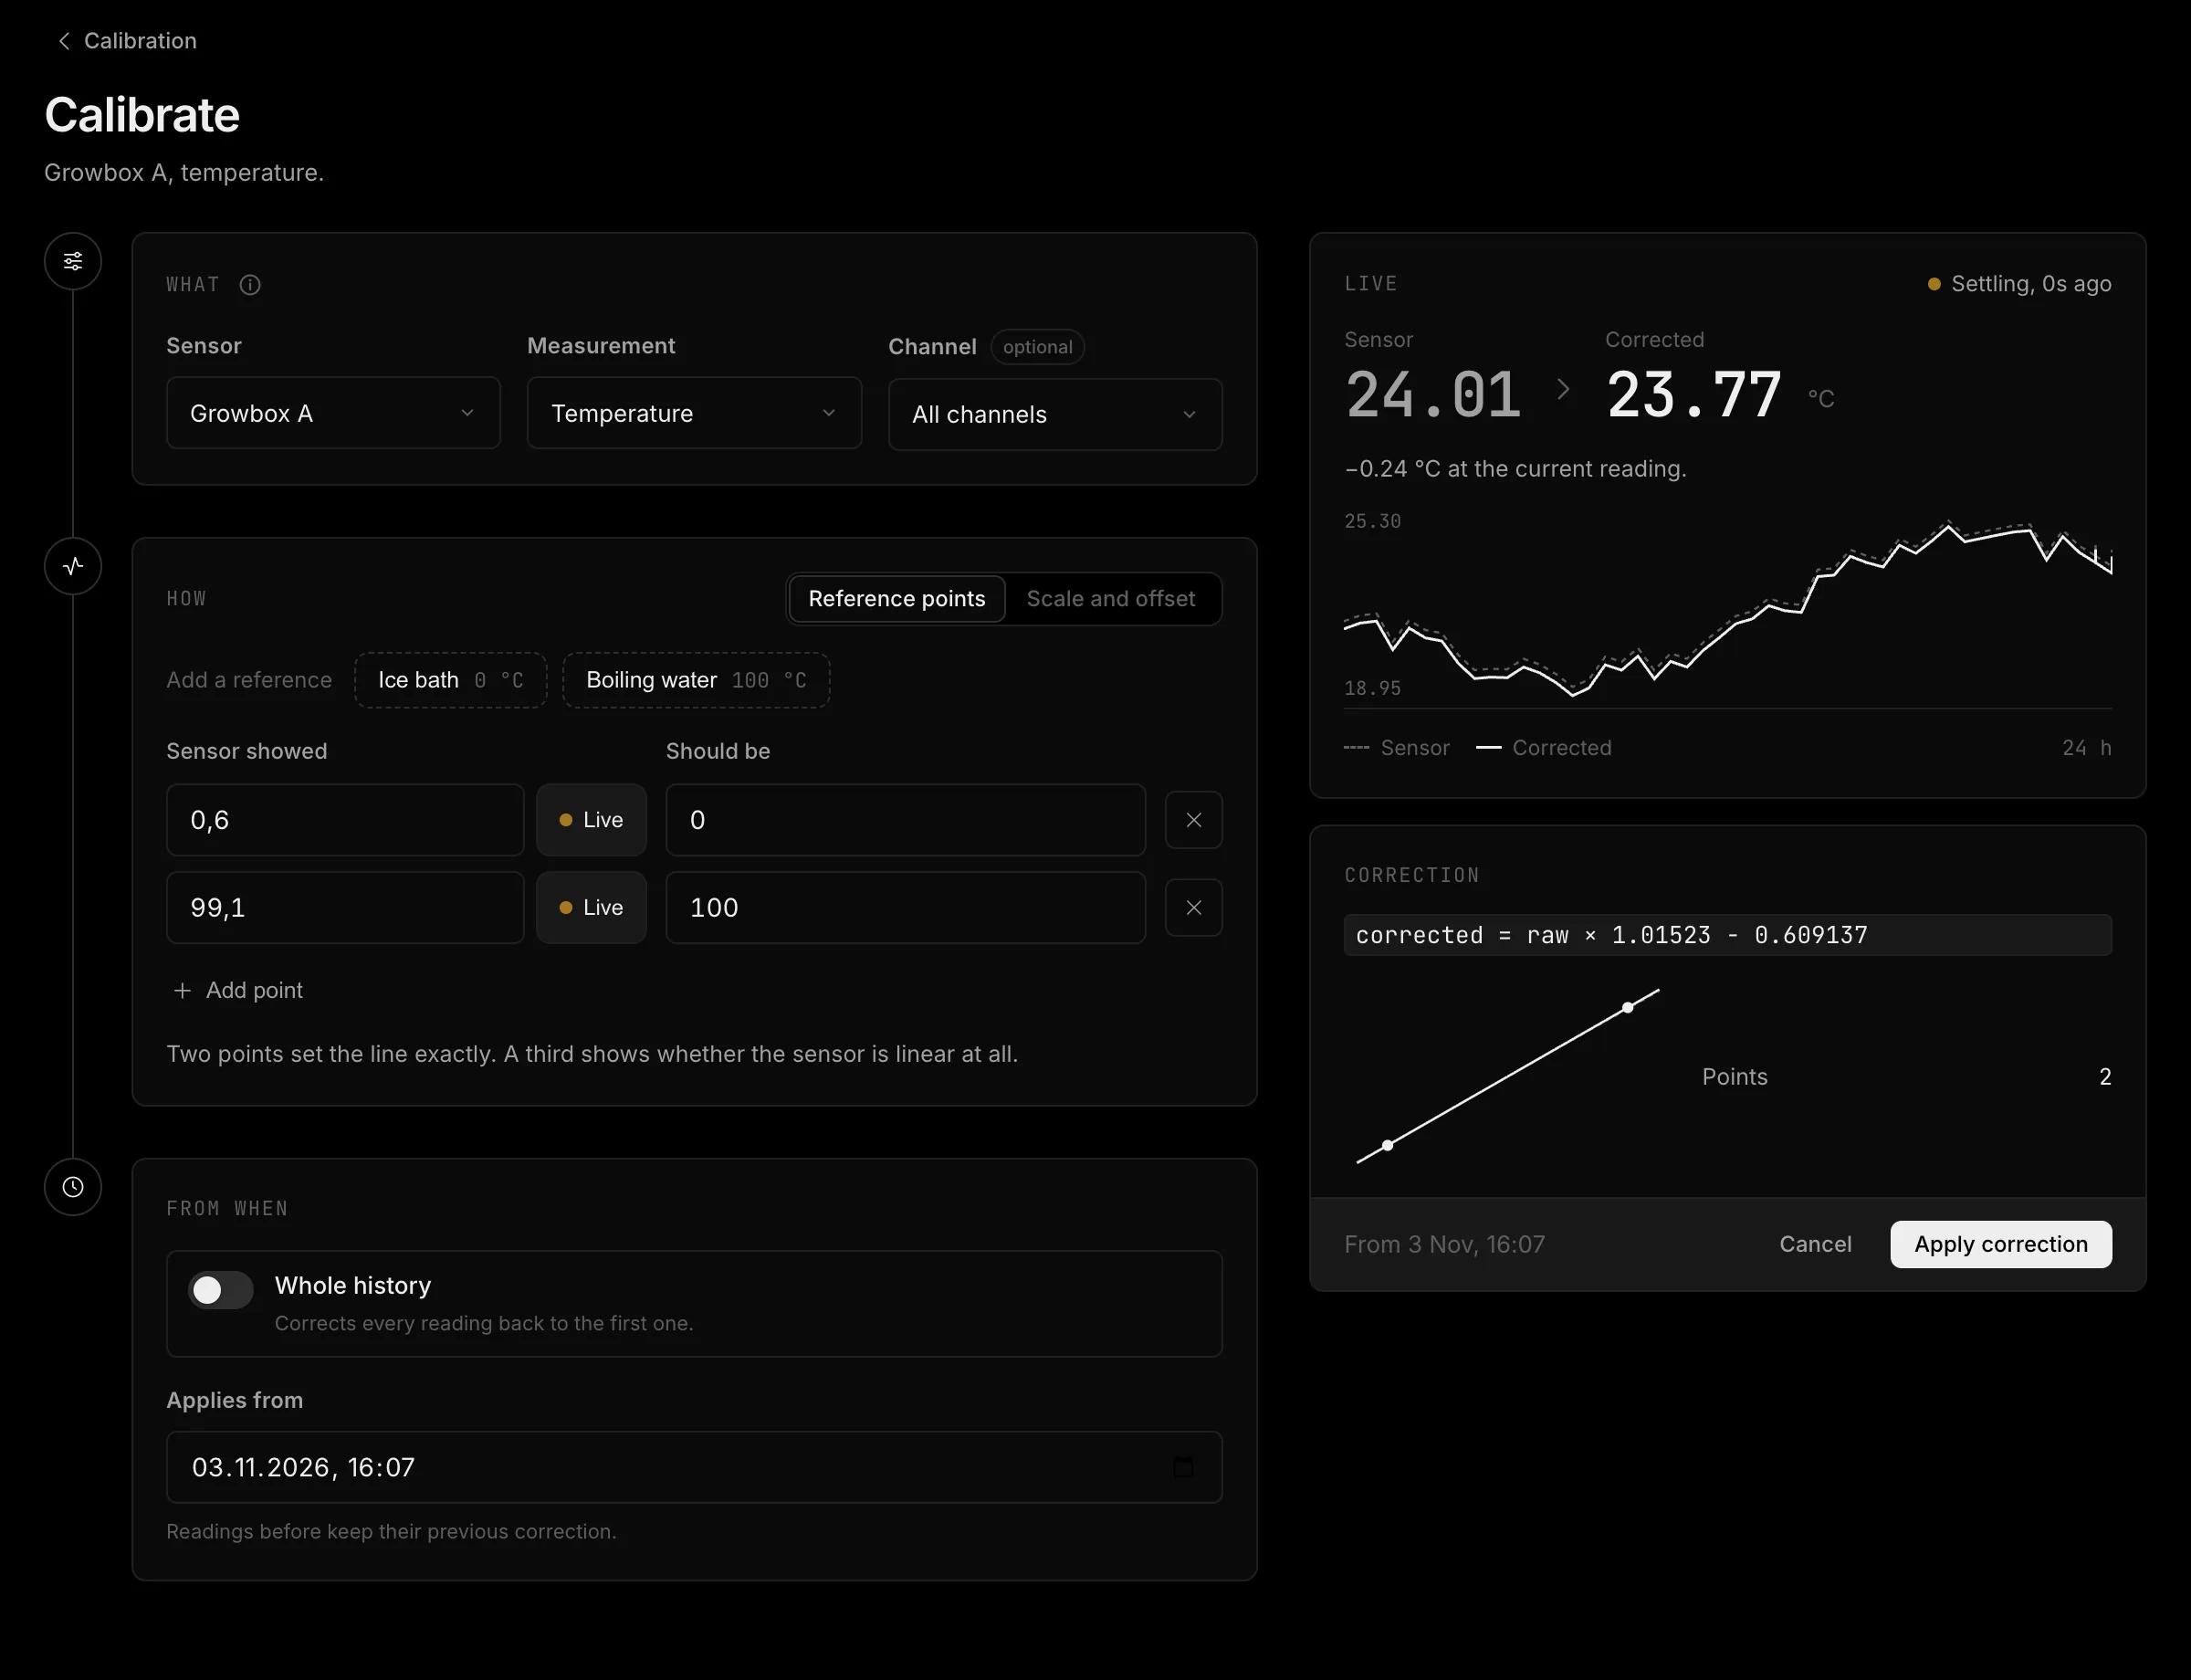
Calibration lists your sensors with their values. Press Calibrate on a value. The correction applies when readings are shown, exported or checked; the raw measurements never change, so you can always undo it.
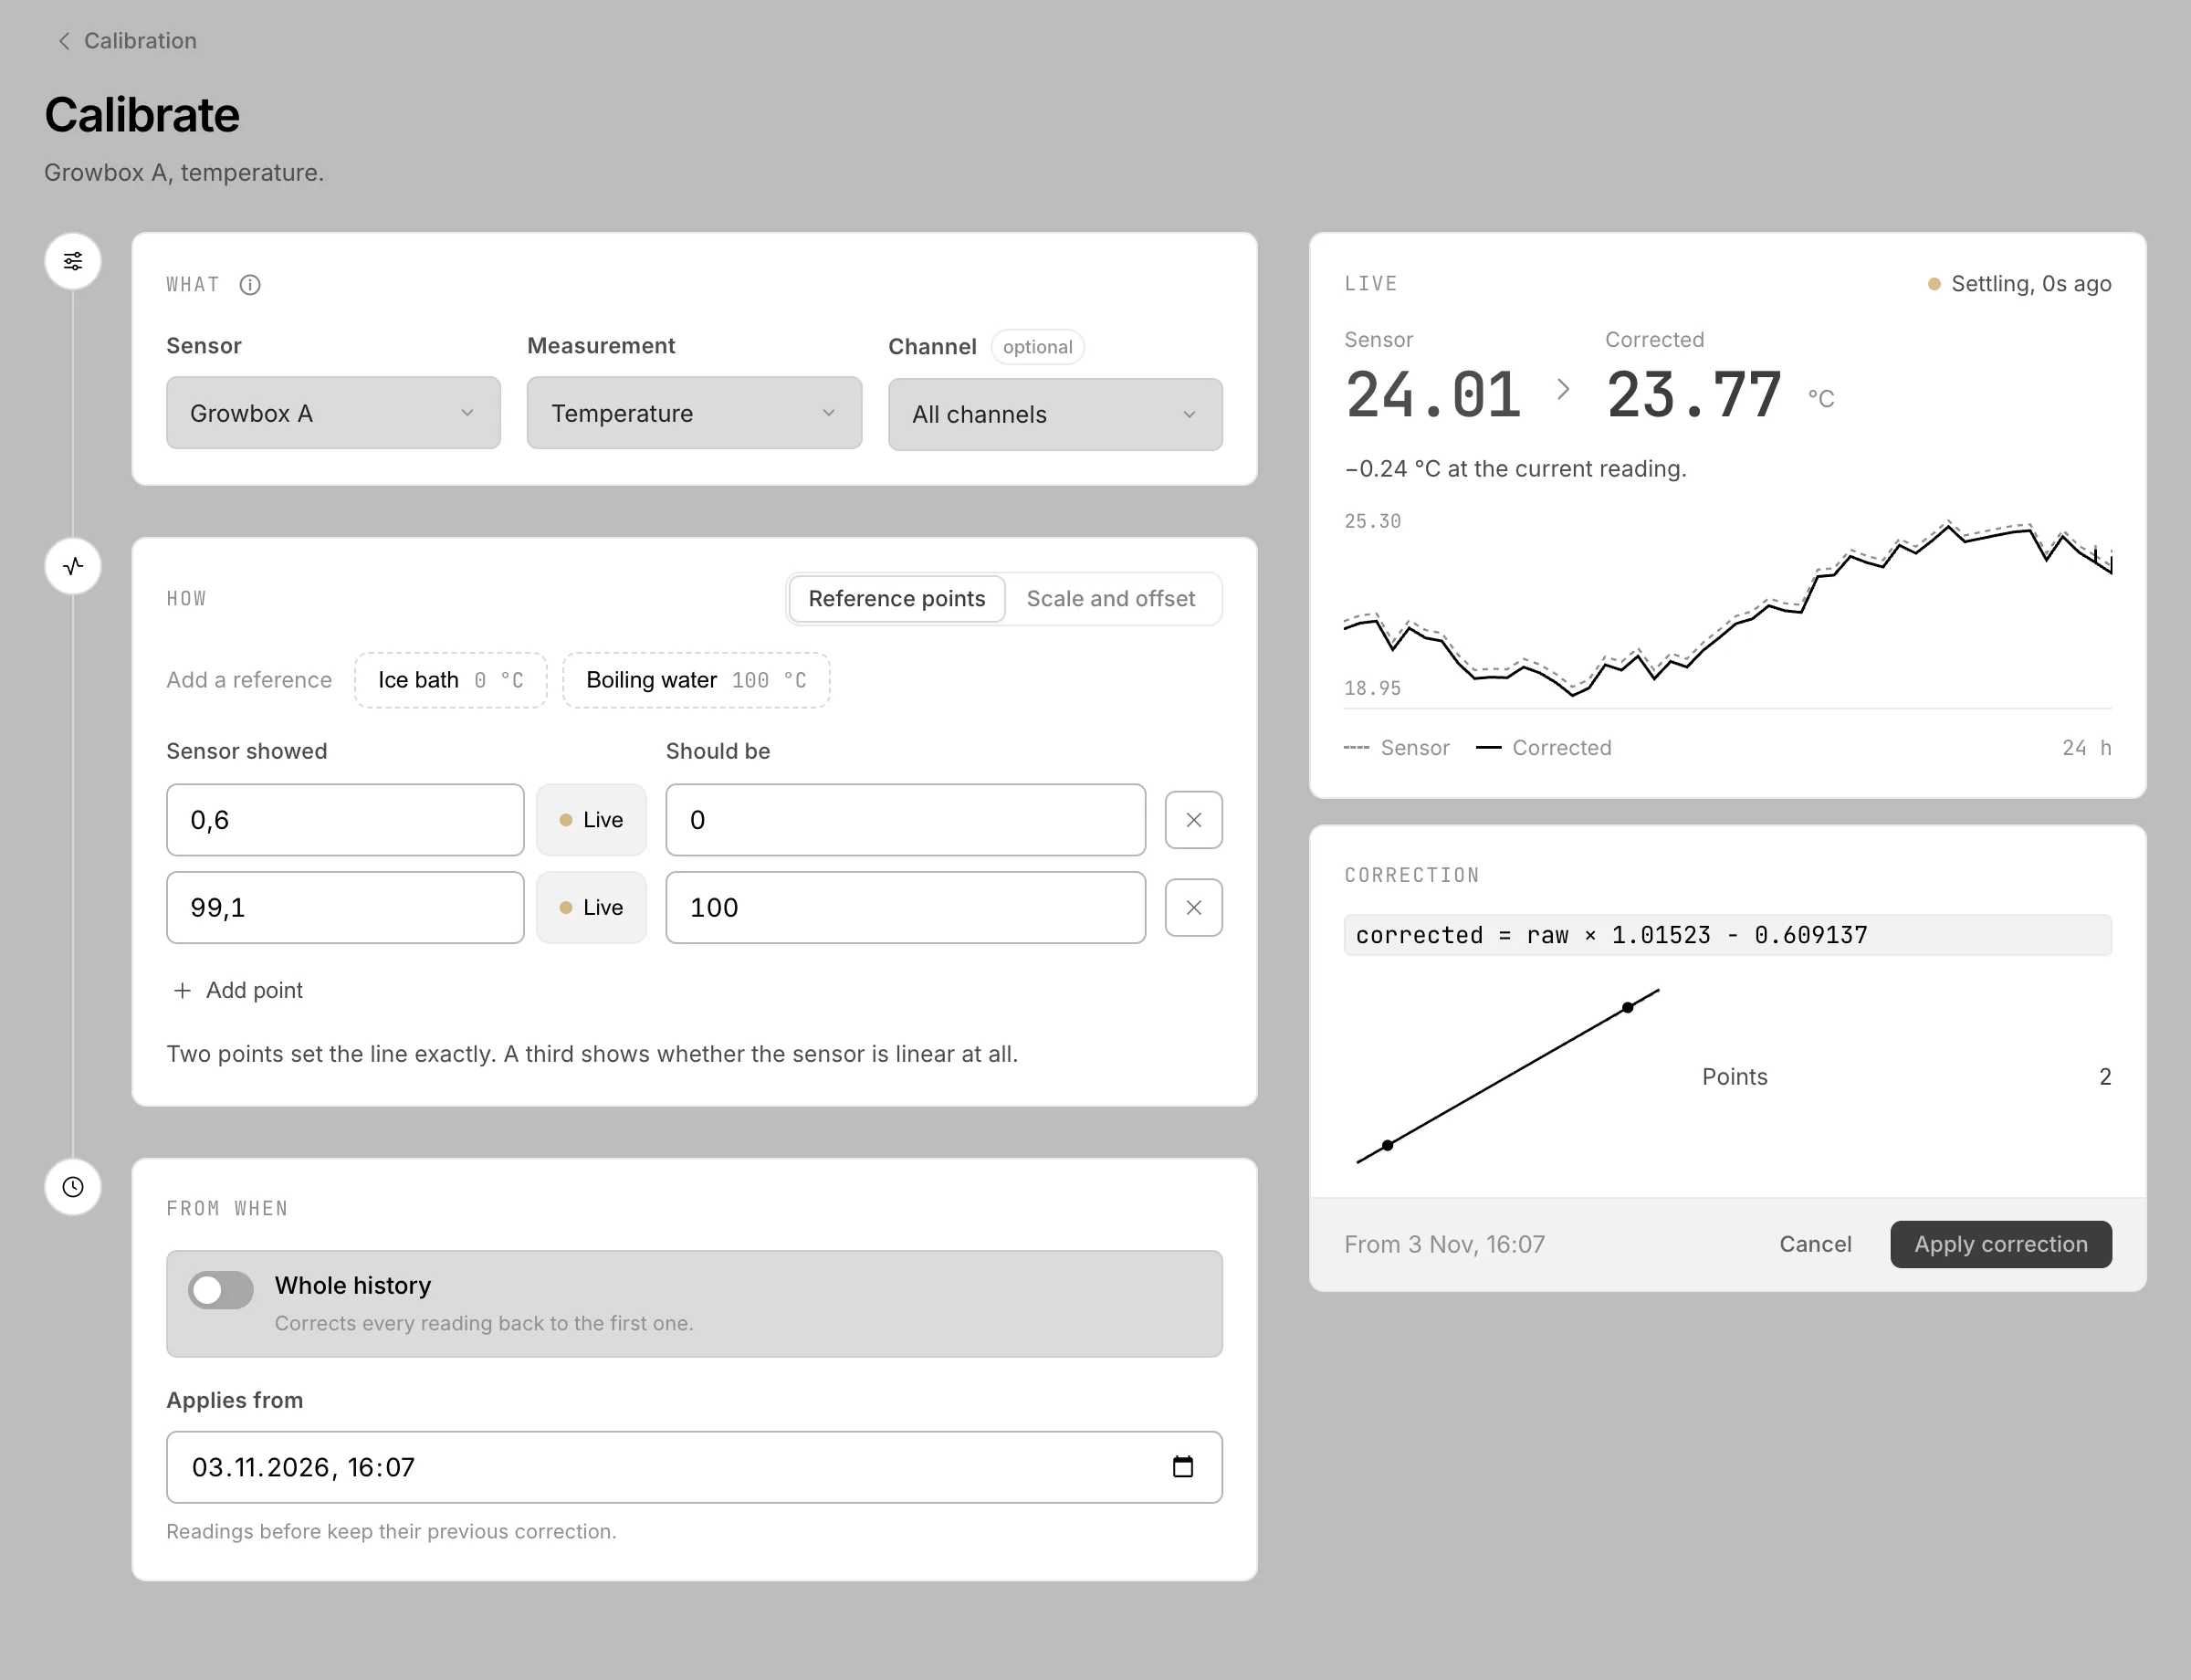
- 1WhatSensor and measurement are set. Pick a Channel if the sensor has two of the same kind, for example two temperature probes.
- 2HowReference points: put the sensor next to something you trust, such as an ice bath, and enter what the sensor showed and what it should be. Live takes the current reading once the dot turns green. Or pick Scale and offset and type the numbers.
- 3From whenWhole history corrects every reading back to the first one. Otherwise it applies from the time you set, and older readings keep their previous correction.
- 4Check and applyLive on the right shows the current reading before and after, with the last 24 hours. Correction shows the formula and how well the points fit. Then press Apply correction.
- One point shifts every reading by the same amount.
- Two points set the line exactly. Pick them far apart.
- Three or more points are averaged into the best line. The point that fits worst is marked, so you see whether the sensor is linear at all.
| Measurement | Ready-made references |
|---|---|
| Temperature | Ice bath 0 °C, boiling water 100 °C |
| Humidity | Salt test 75 %, MgCl₂ test 33 % |
| CO₂ | Outdoor air |
| Soil moisture | Dry in air, in water |
| pH | Buffer pH 4, 7 and 10 |
| Conductivity | 1413 µS/cm, 12.88 mS/cm |
The owner and people with Can edit or Can manage calibrate a sensor.
A period as PDF or CSV
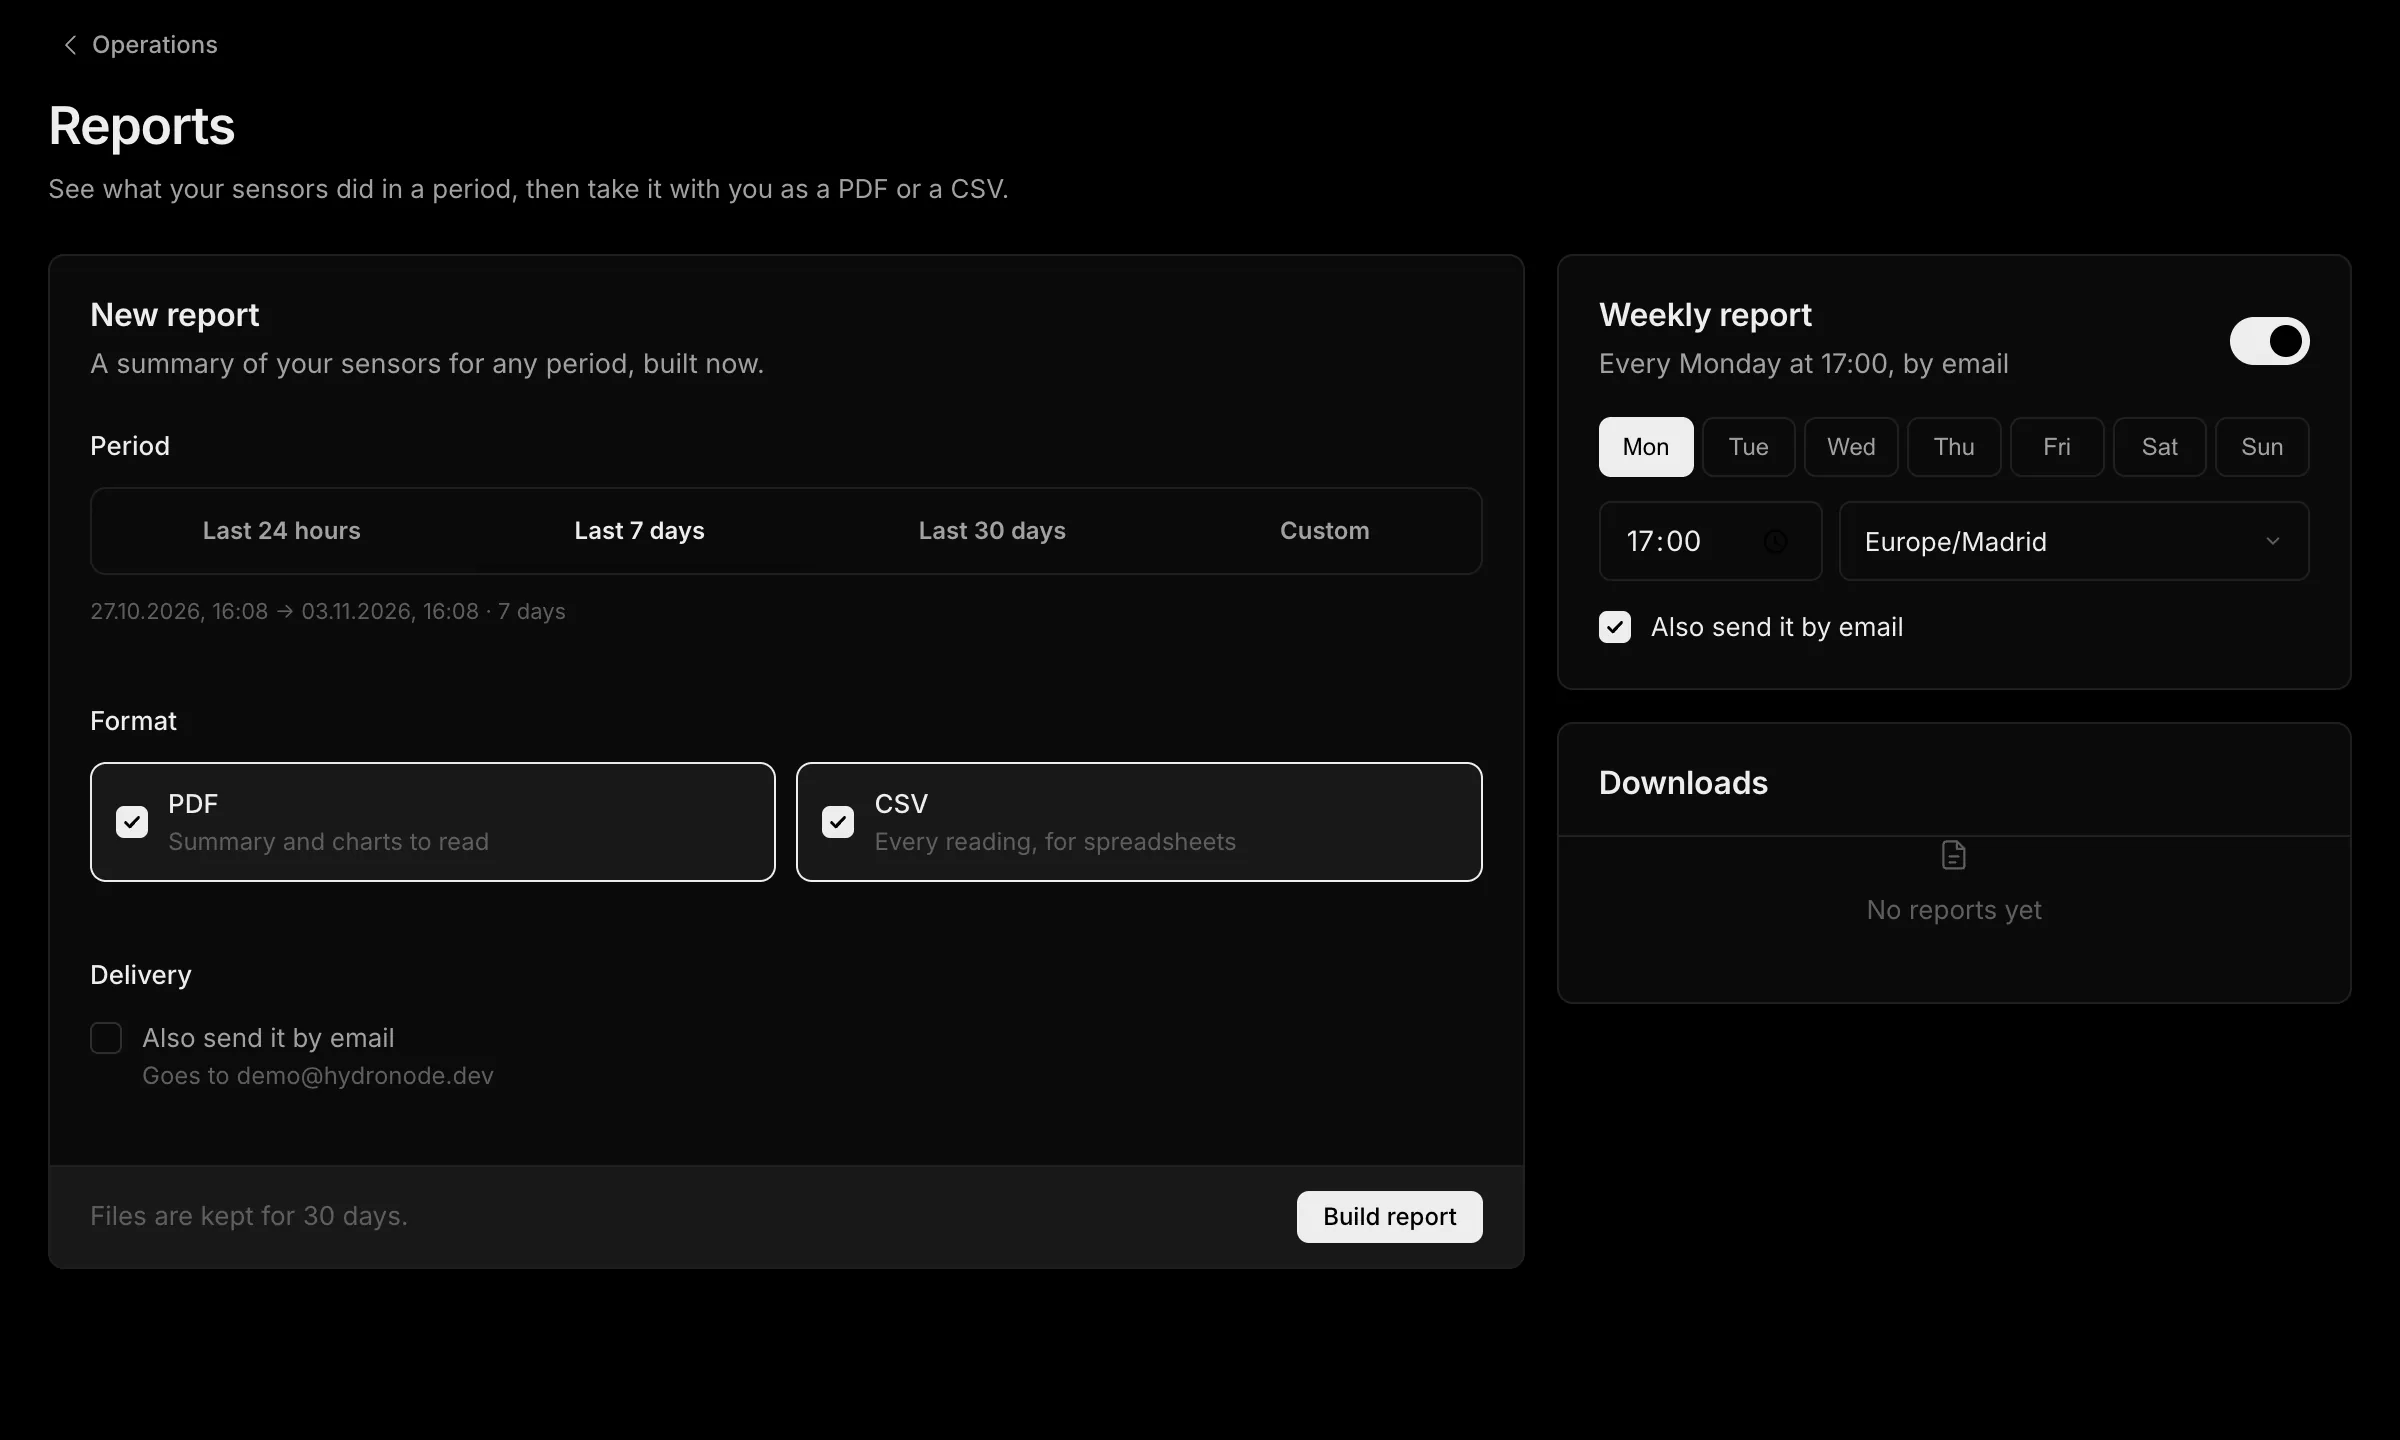
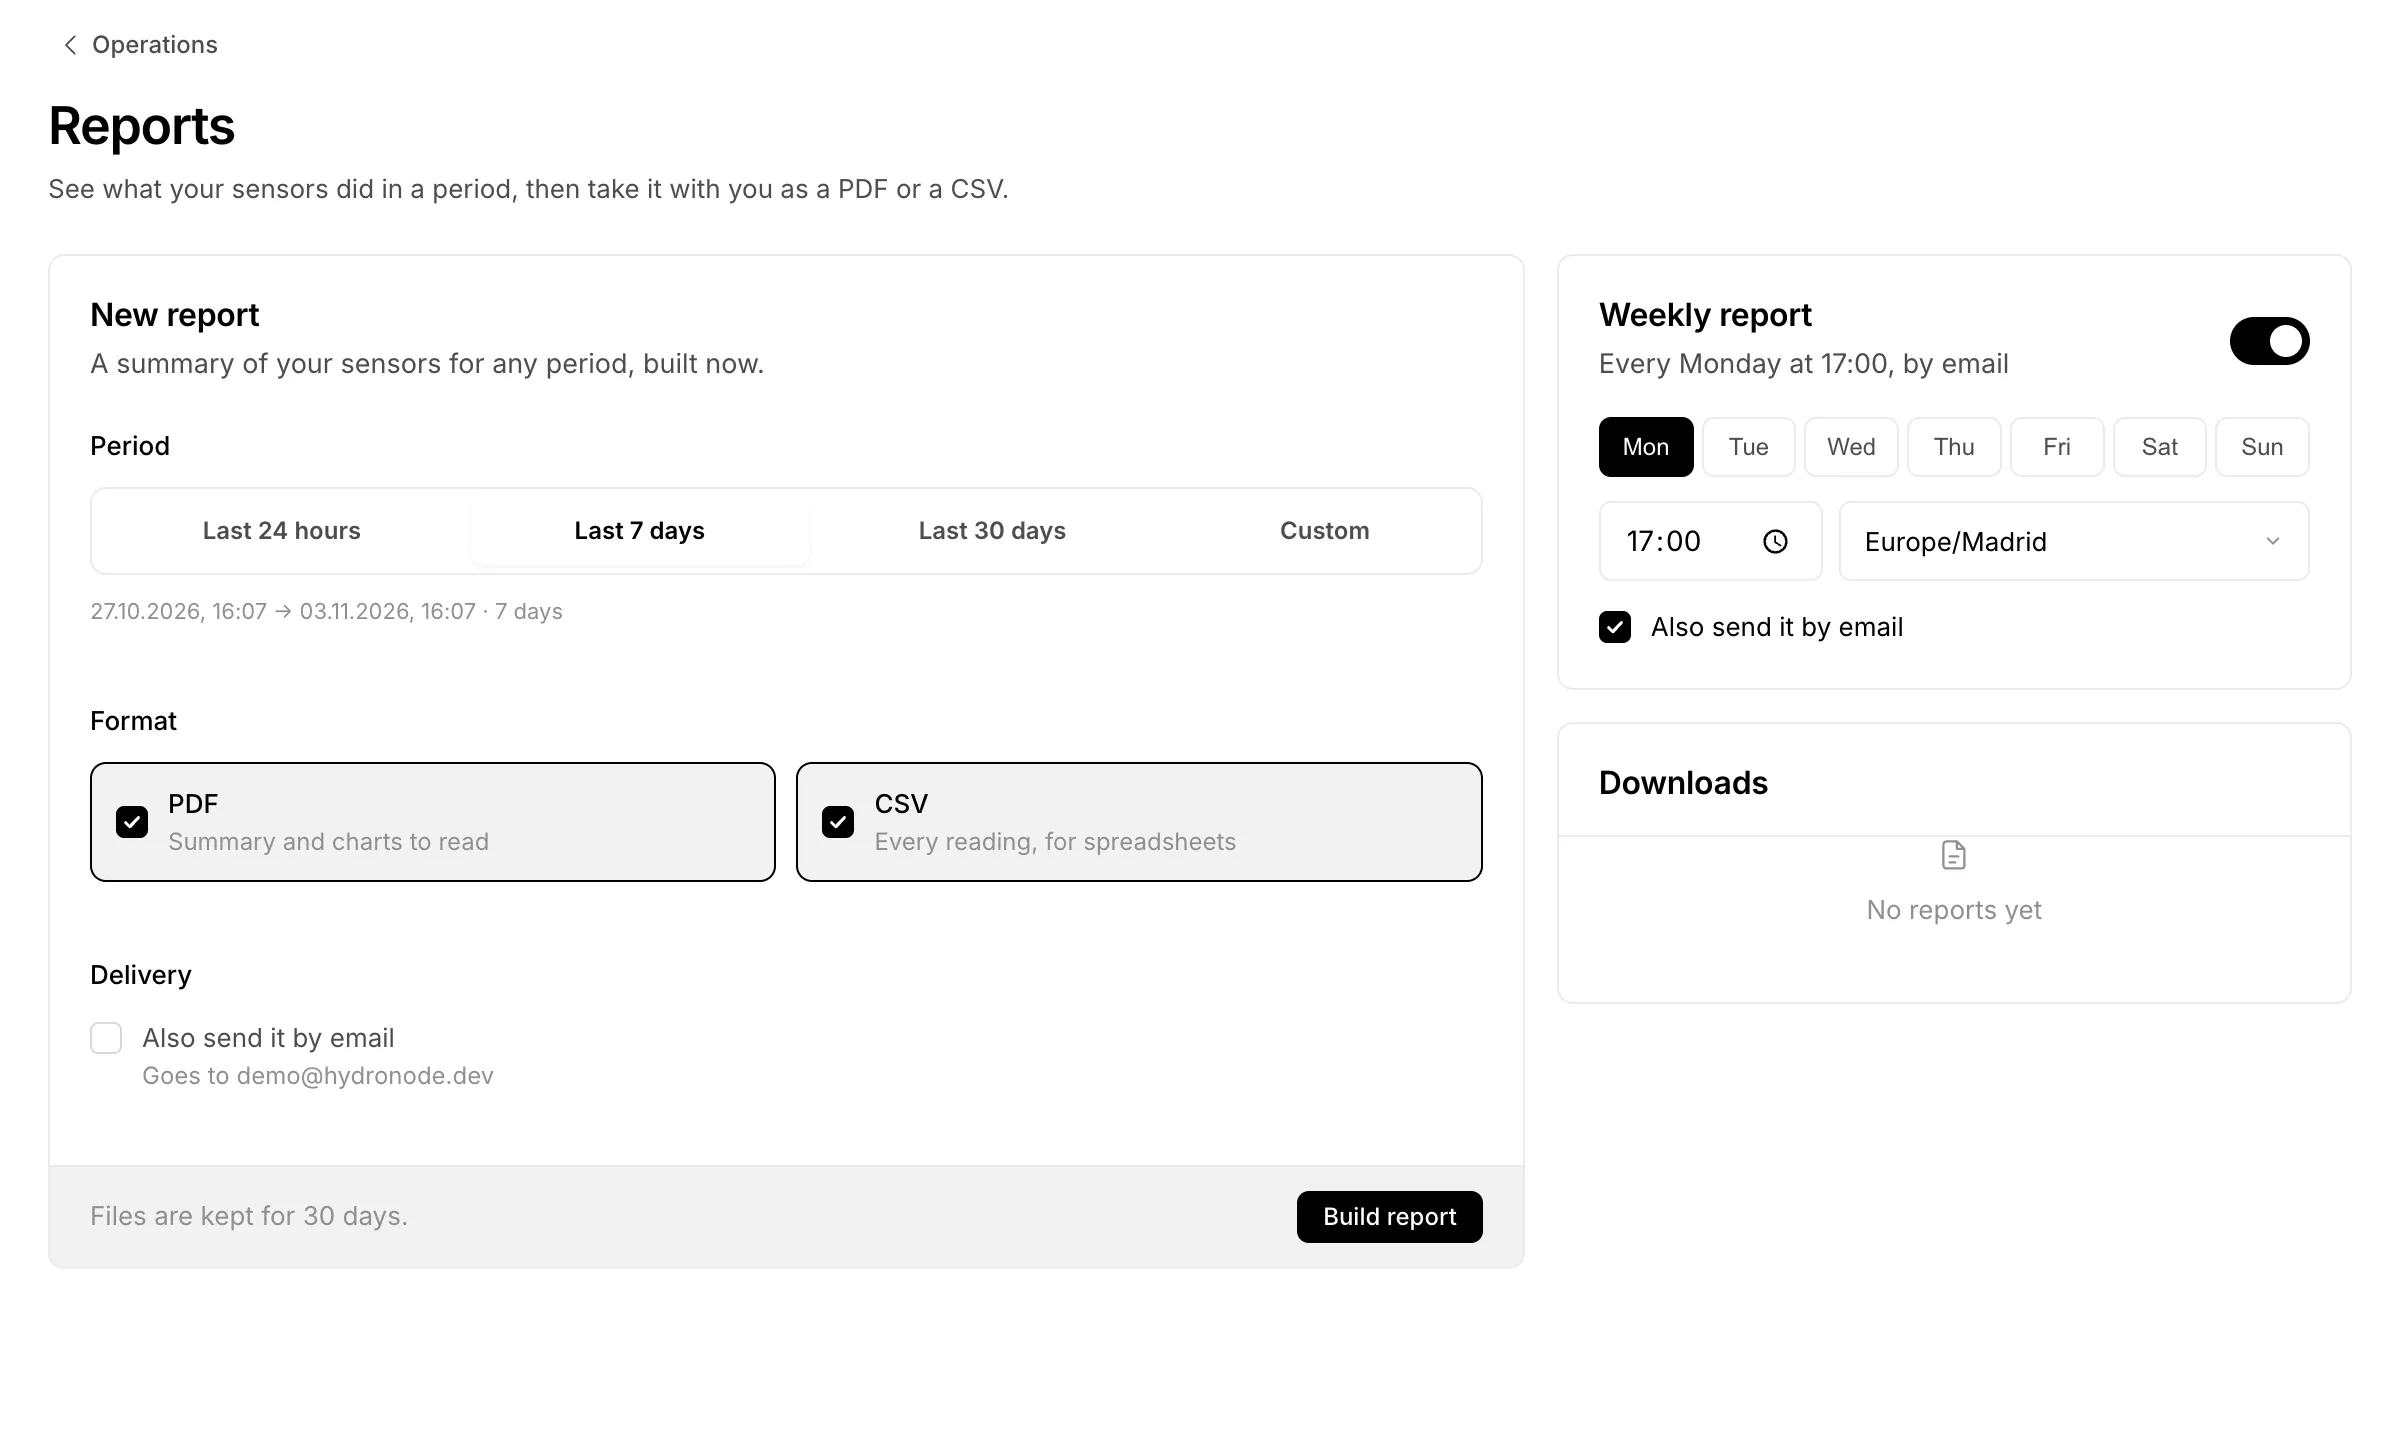
New report sums up your sensors for any period: the last 24 hours, 7 or 30 days or a custom range. Pick PDF to read, CSV for spreadsheets, or both, and whether it should also go out by email. Press Build report; the files wait under Downloads for 30 days.
Weekly report sends the same summary by email on a day and at a time you pick, in your time zone. Every report email has a link to turn it off.
Export and import
Export takes the readings of your sensors and of every sensor shared with you, at any level. Pick the period and the sensors, then the resolution and the format. The box below counts the rows before you download.
| Choice | Options |
|---|---|
| Resolution | Raw (every reading), 5 min, hourly or daily (lowest, average, highest and count) |
| Format | ZIP (CSV plus metadata), CSV, or JSON lines for scripts |
| Limit | 250,000 rows per download. Above it, pick a coarser resolution or fewer sensors. |
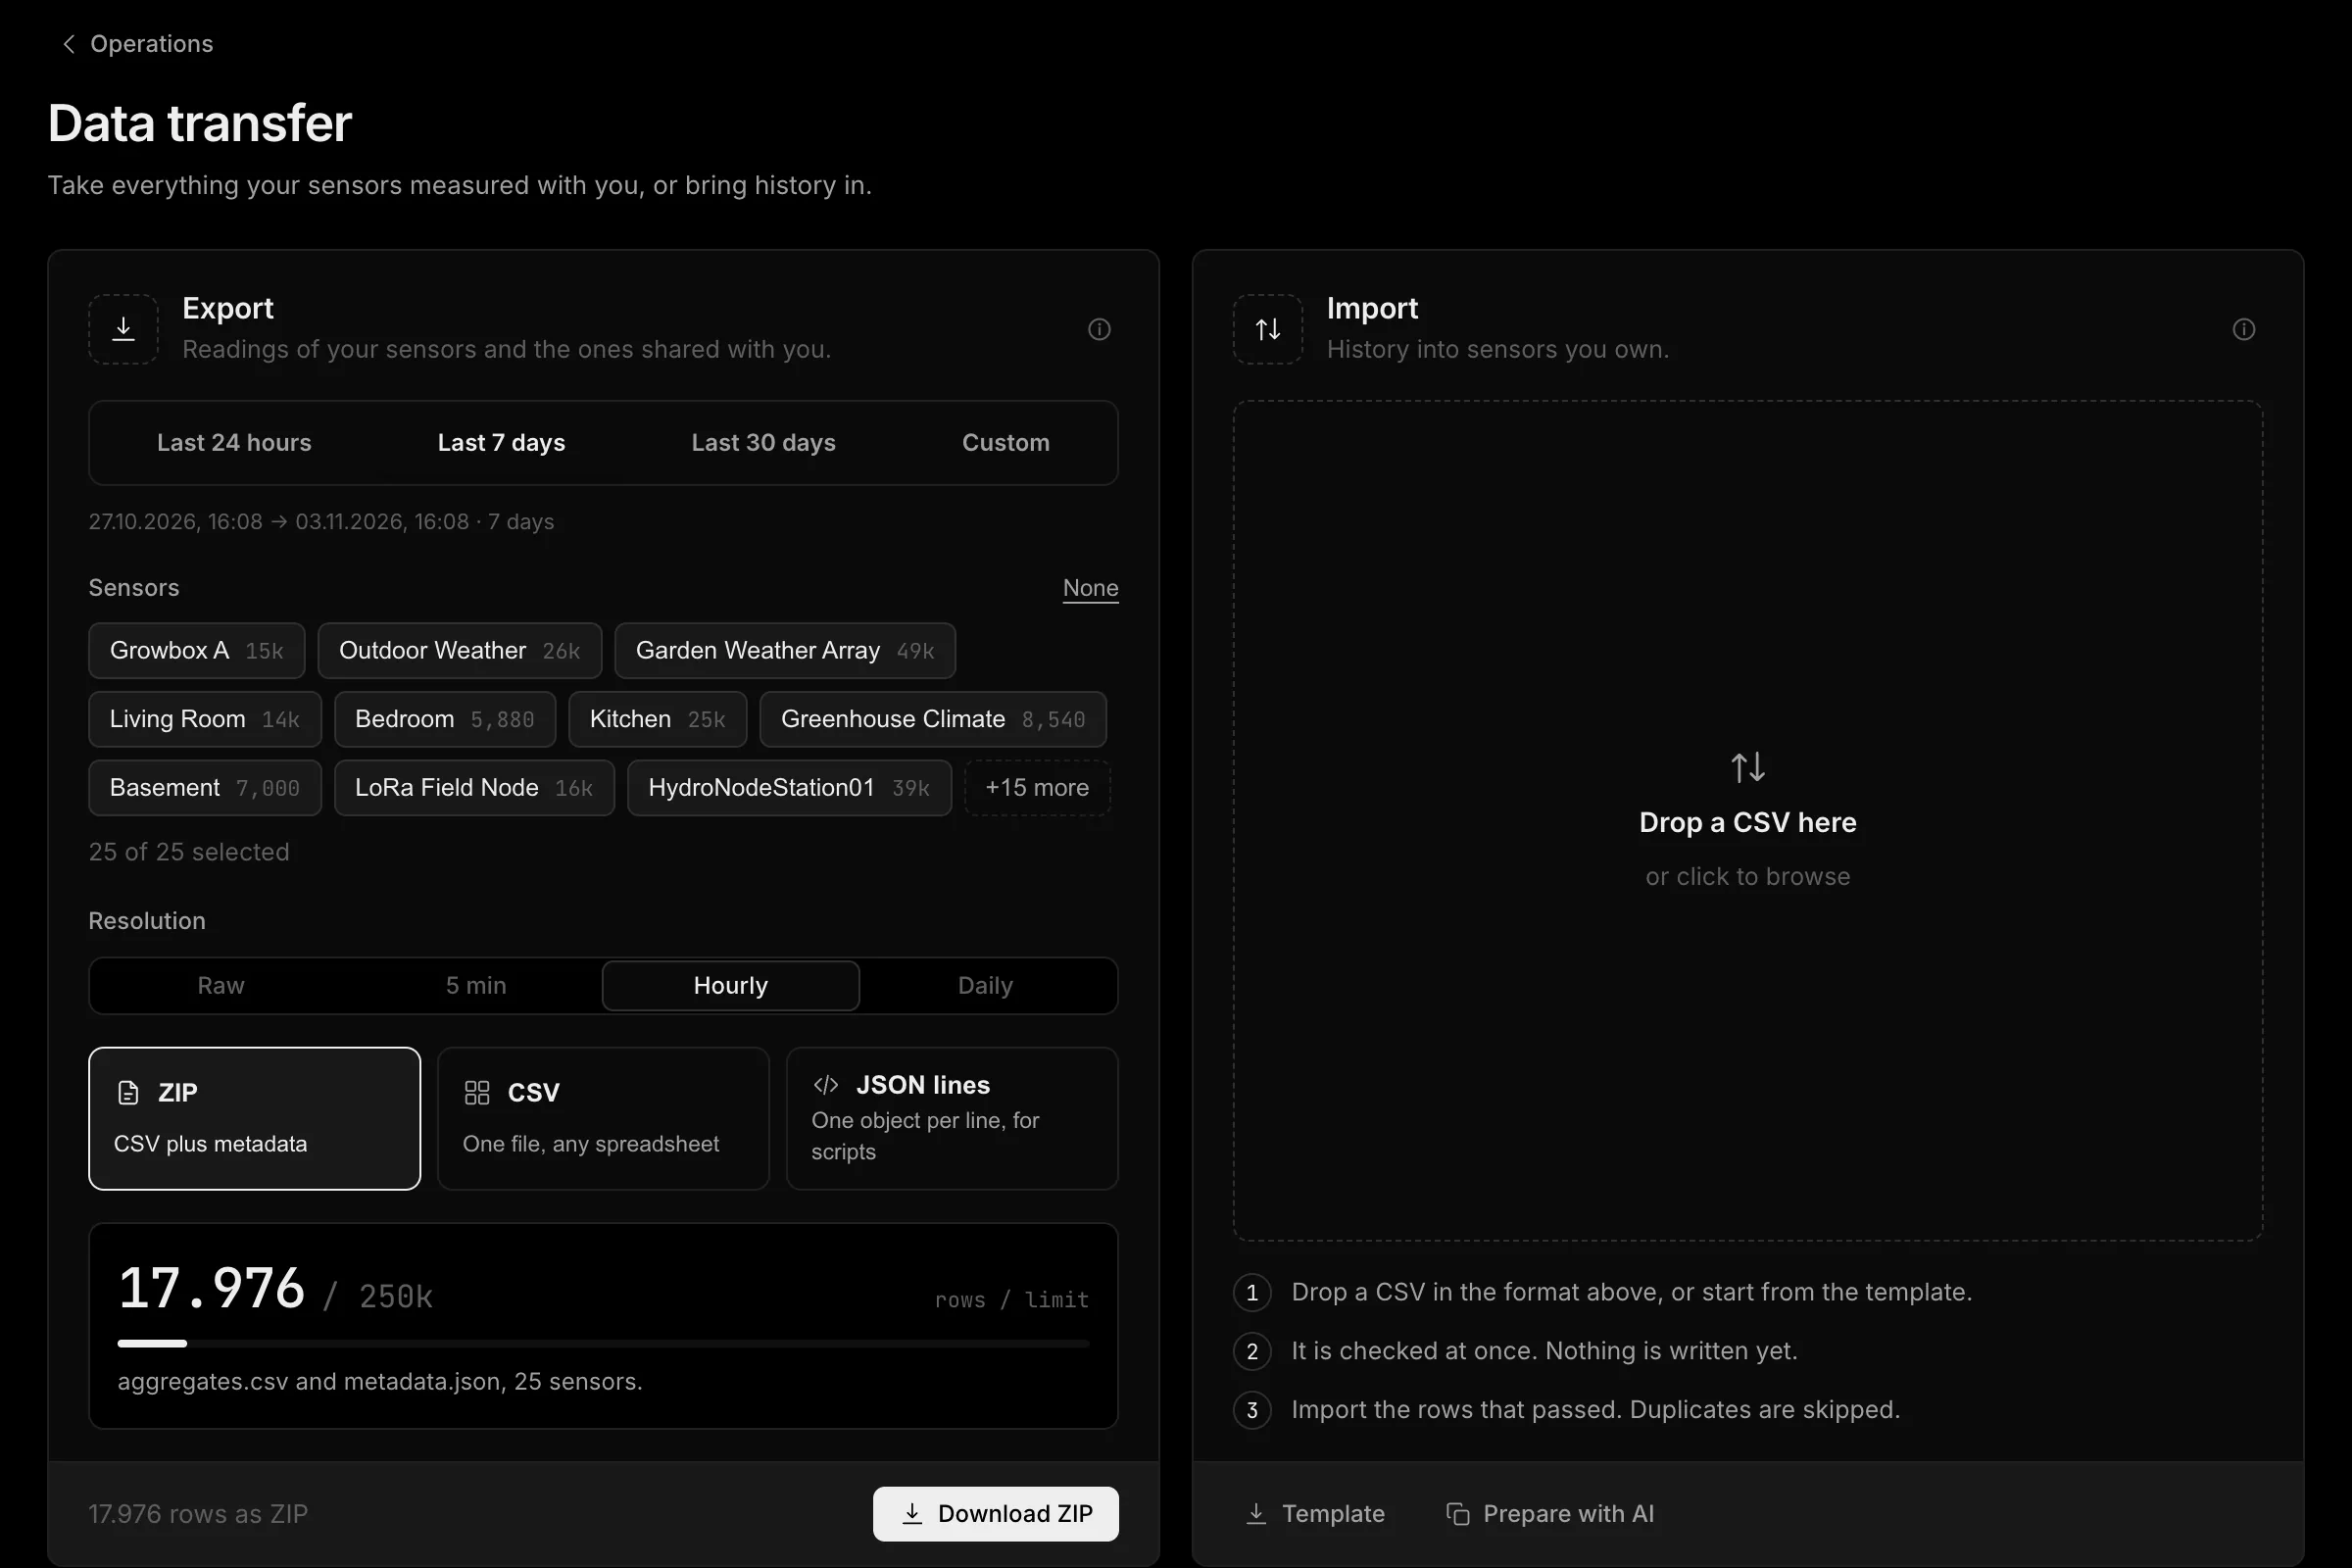
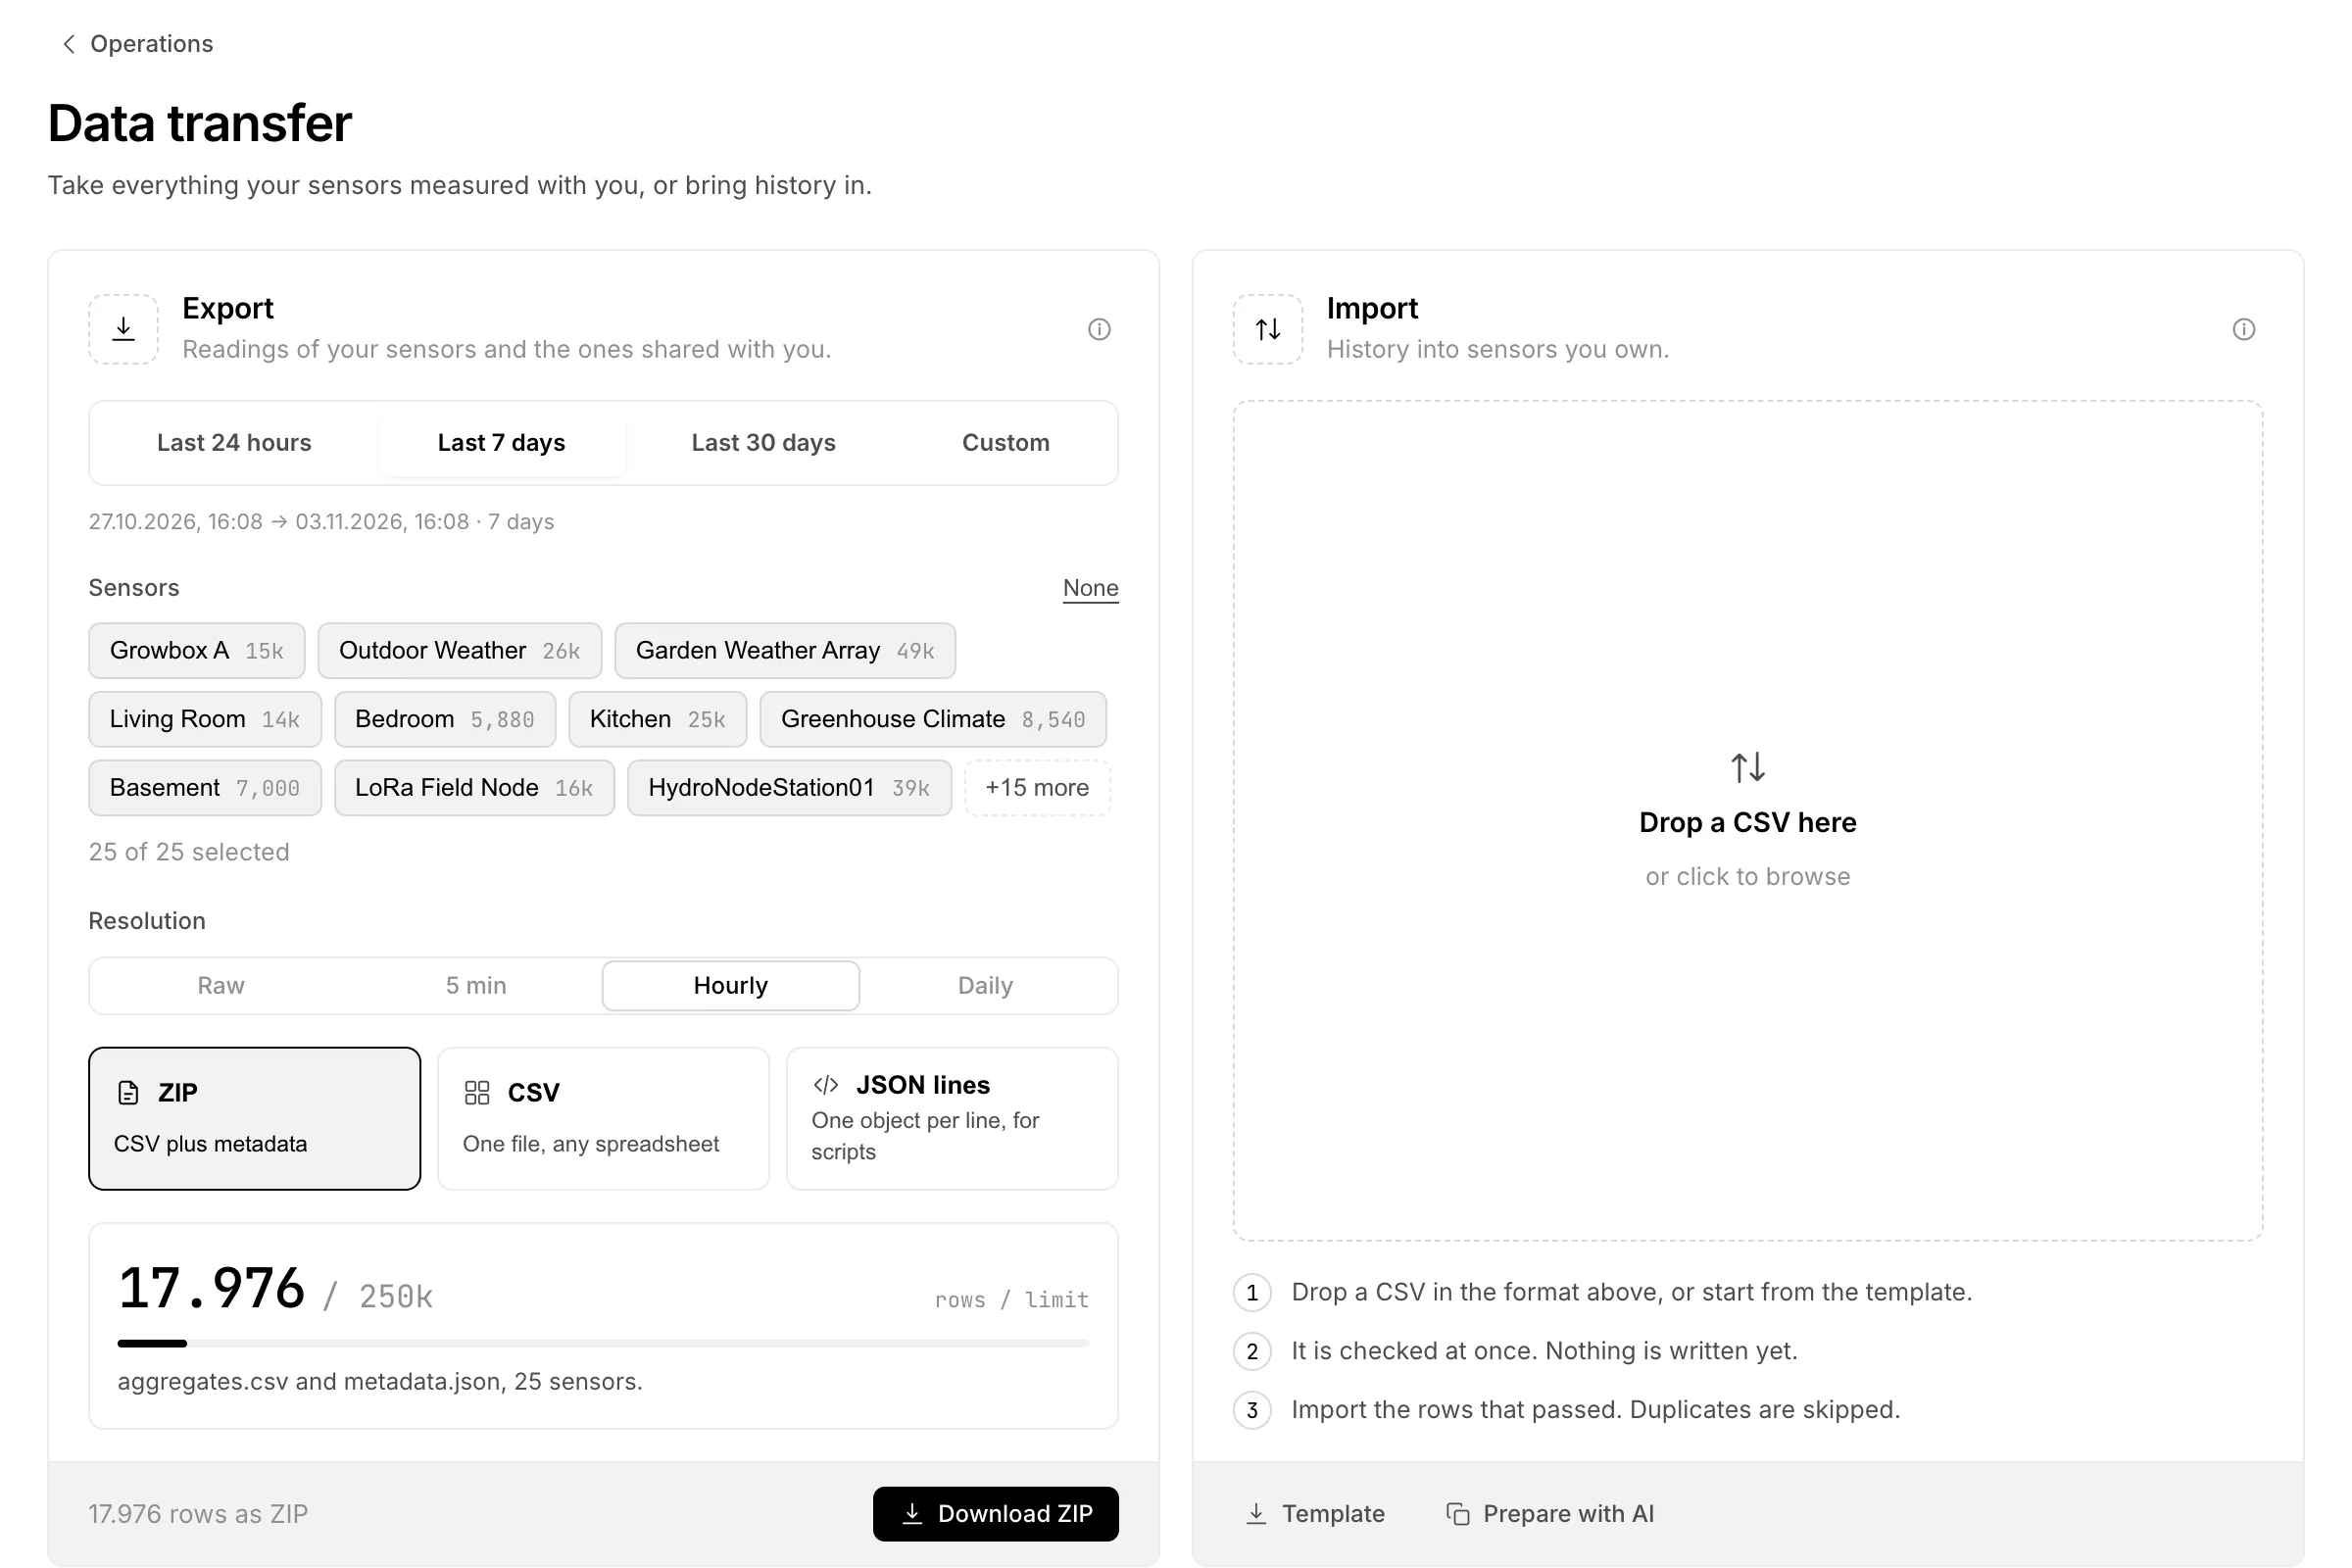
Import brings history into sensors you own, for example readings from an old logger. Drop a CSV in the format of the Template. HydroNode checks it at once and writes nothing yet; then import the rows that passed. Rows that already exist are skipped, so importing the same file twice does no harm. Your file looks different? Prepare with AI copies a prompt that turns it into the right format with any AI assistant.
Everything that ran
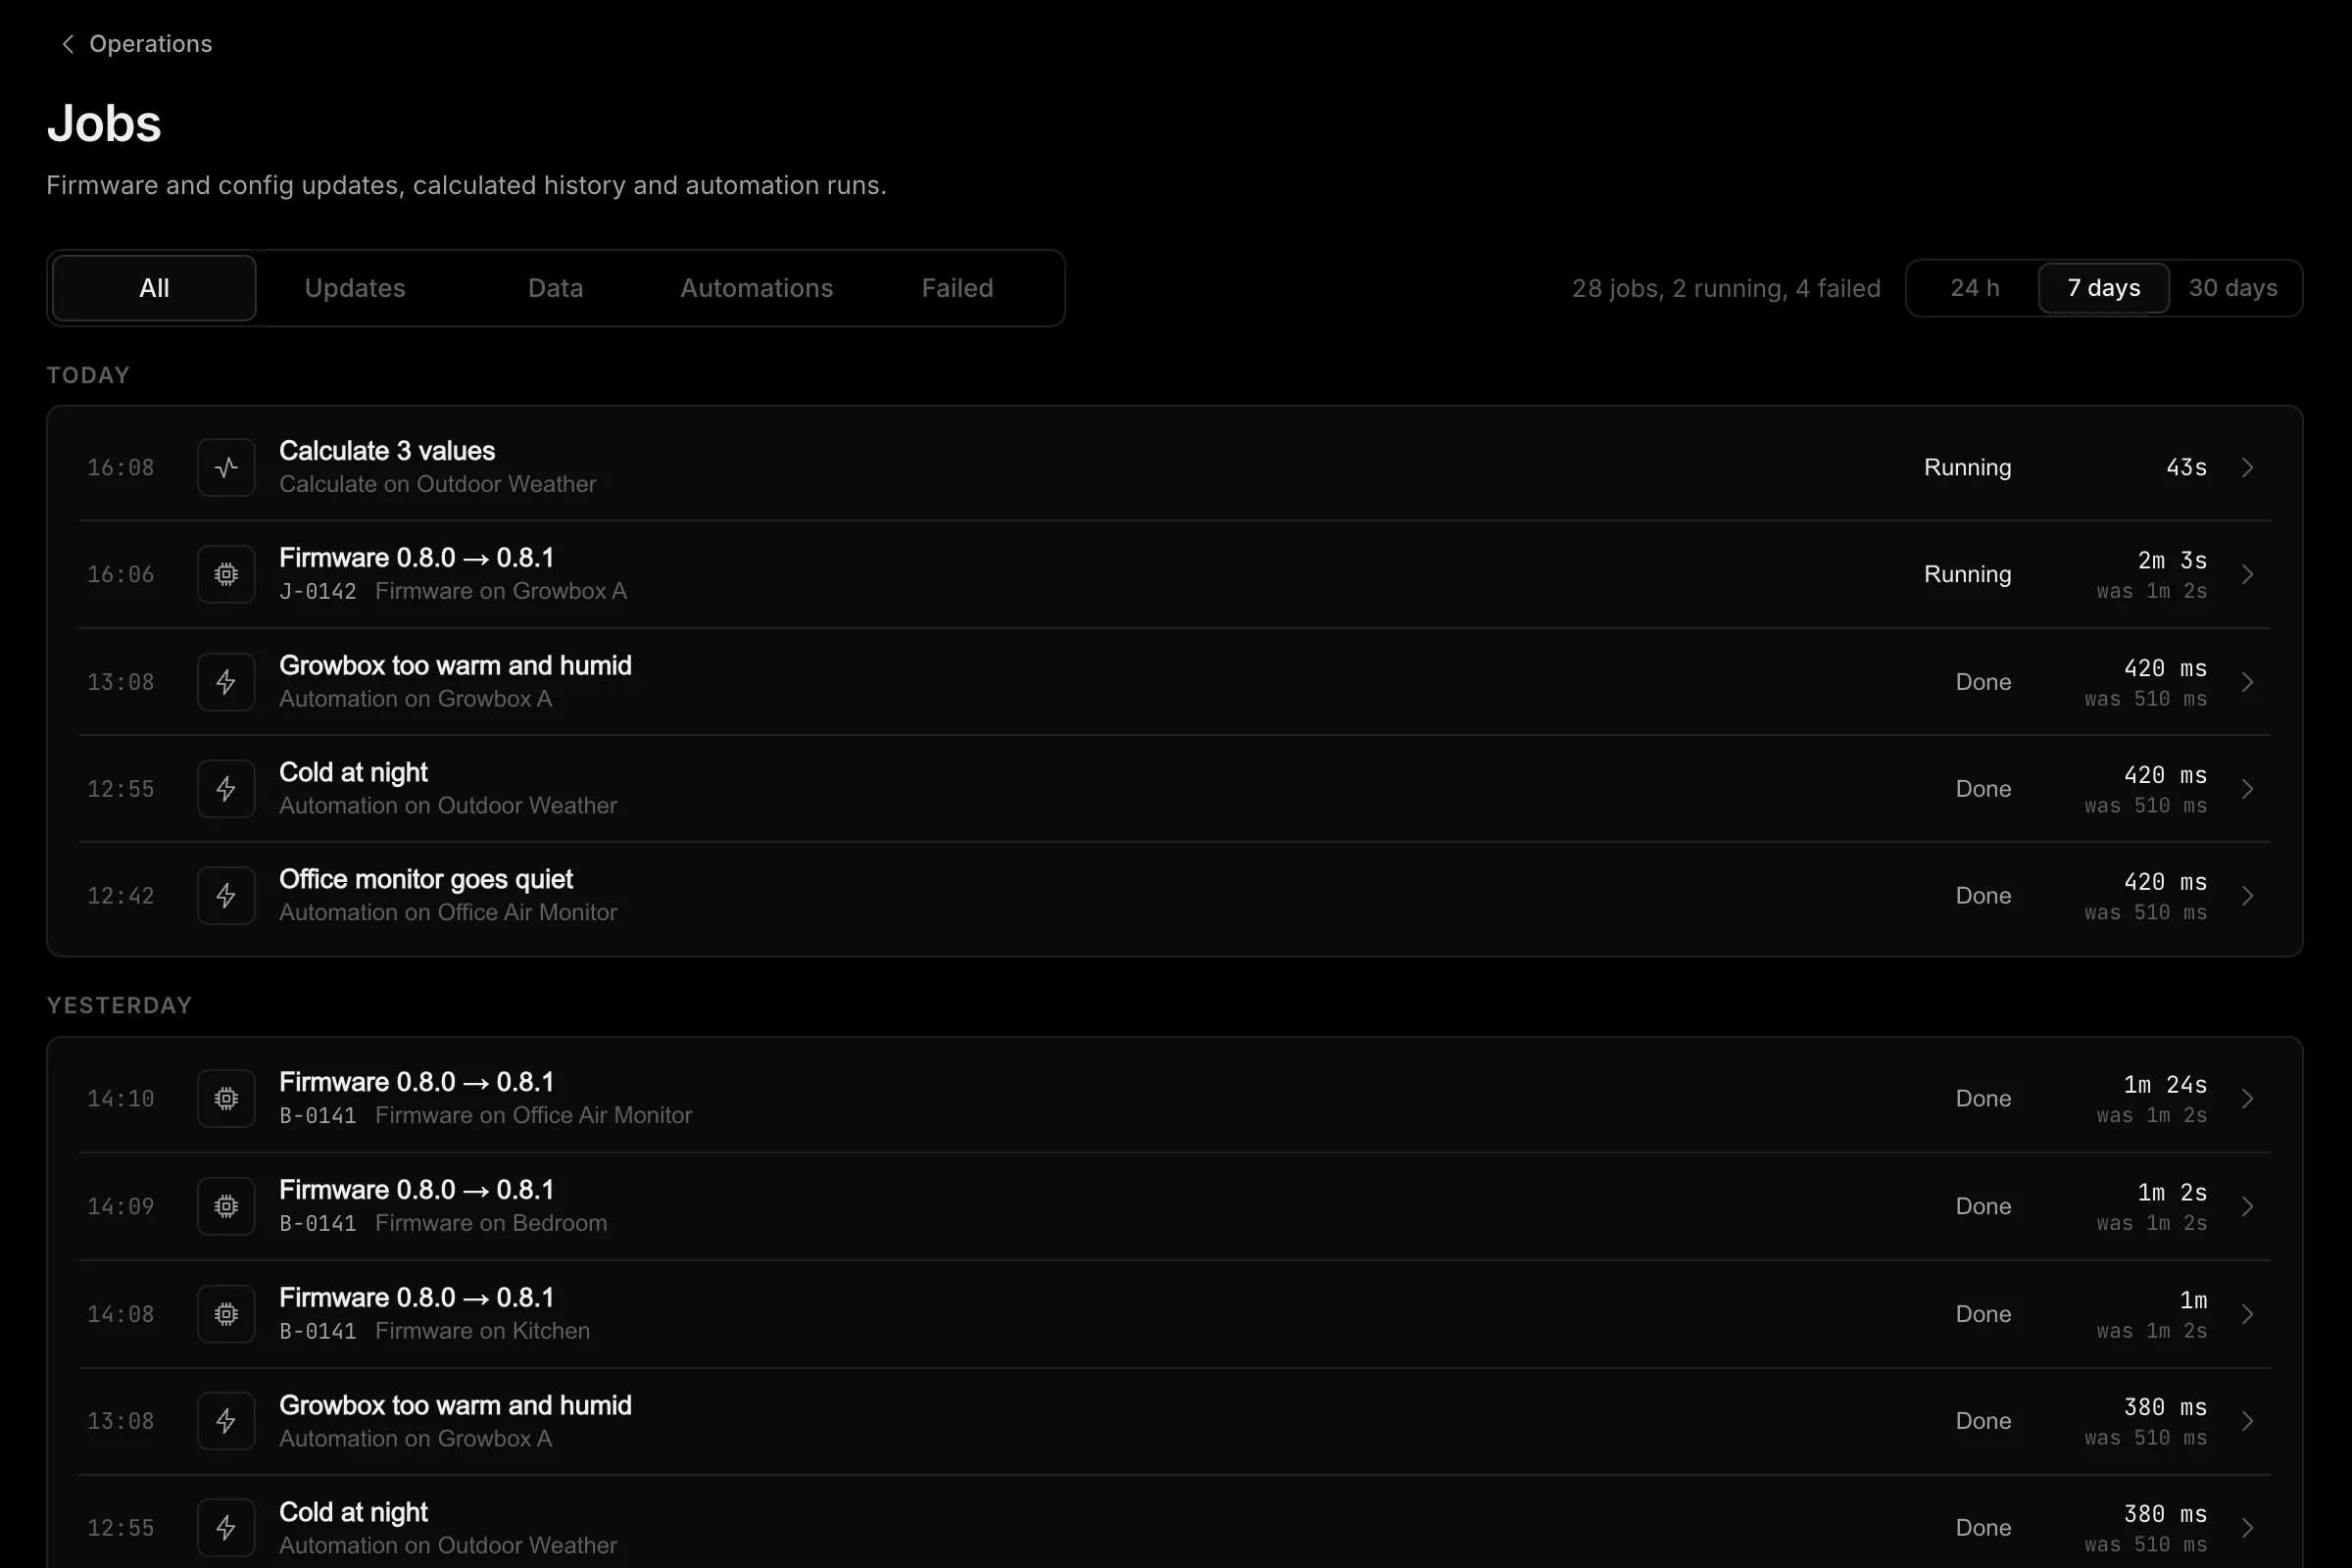
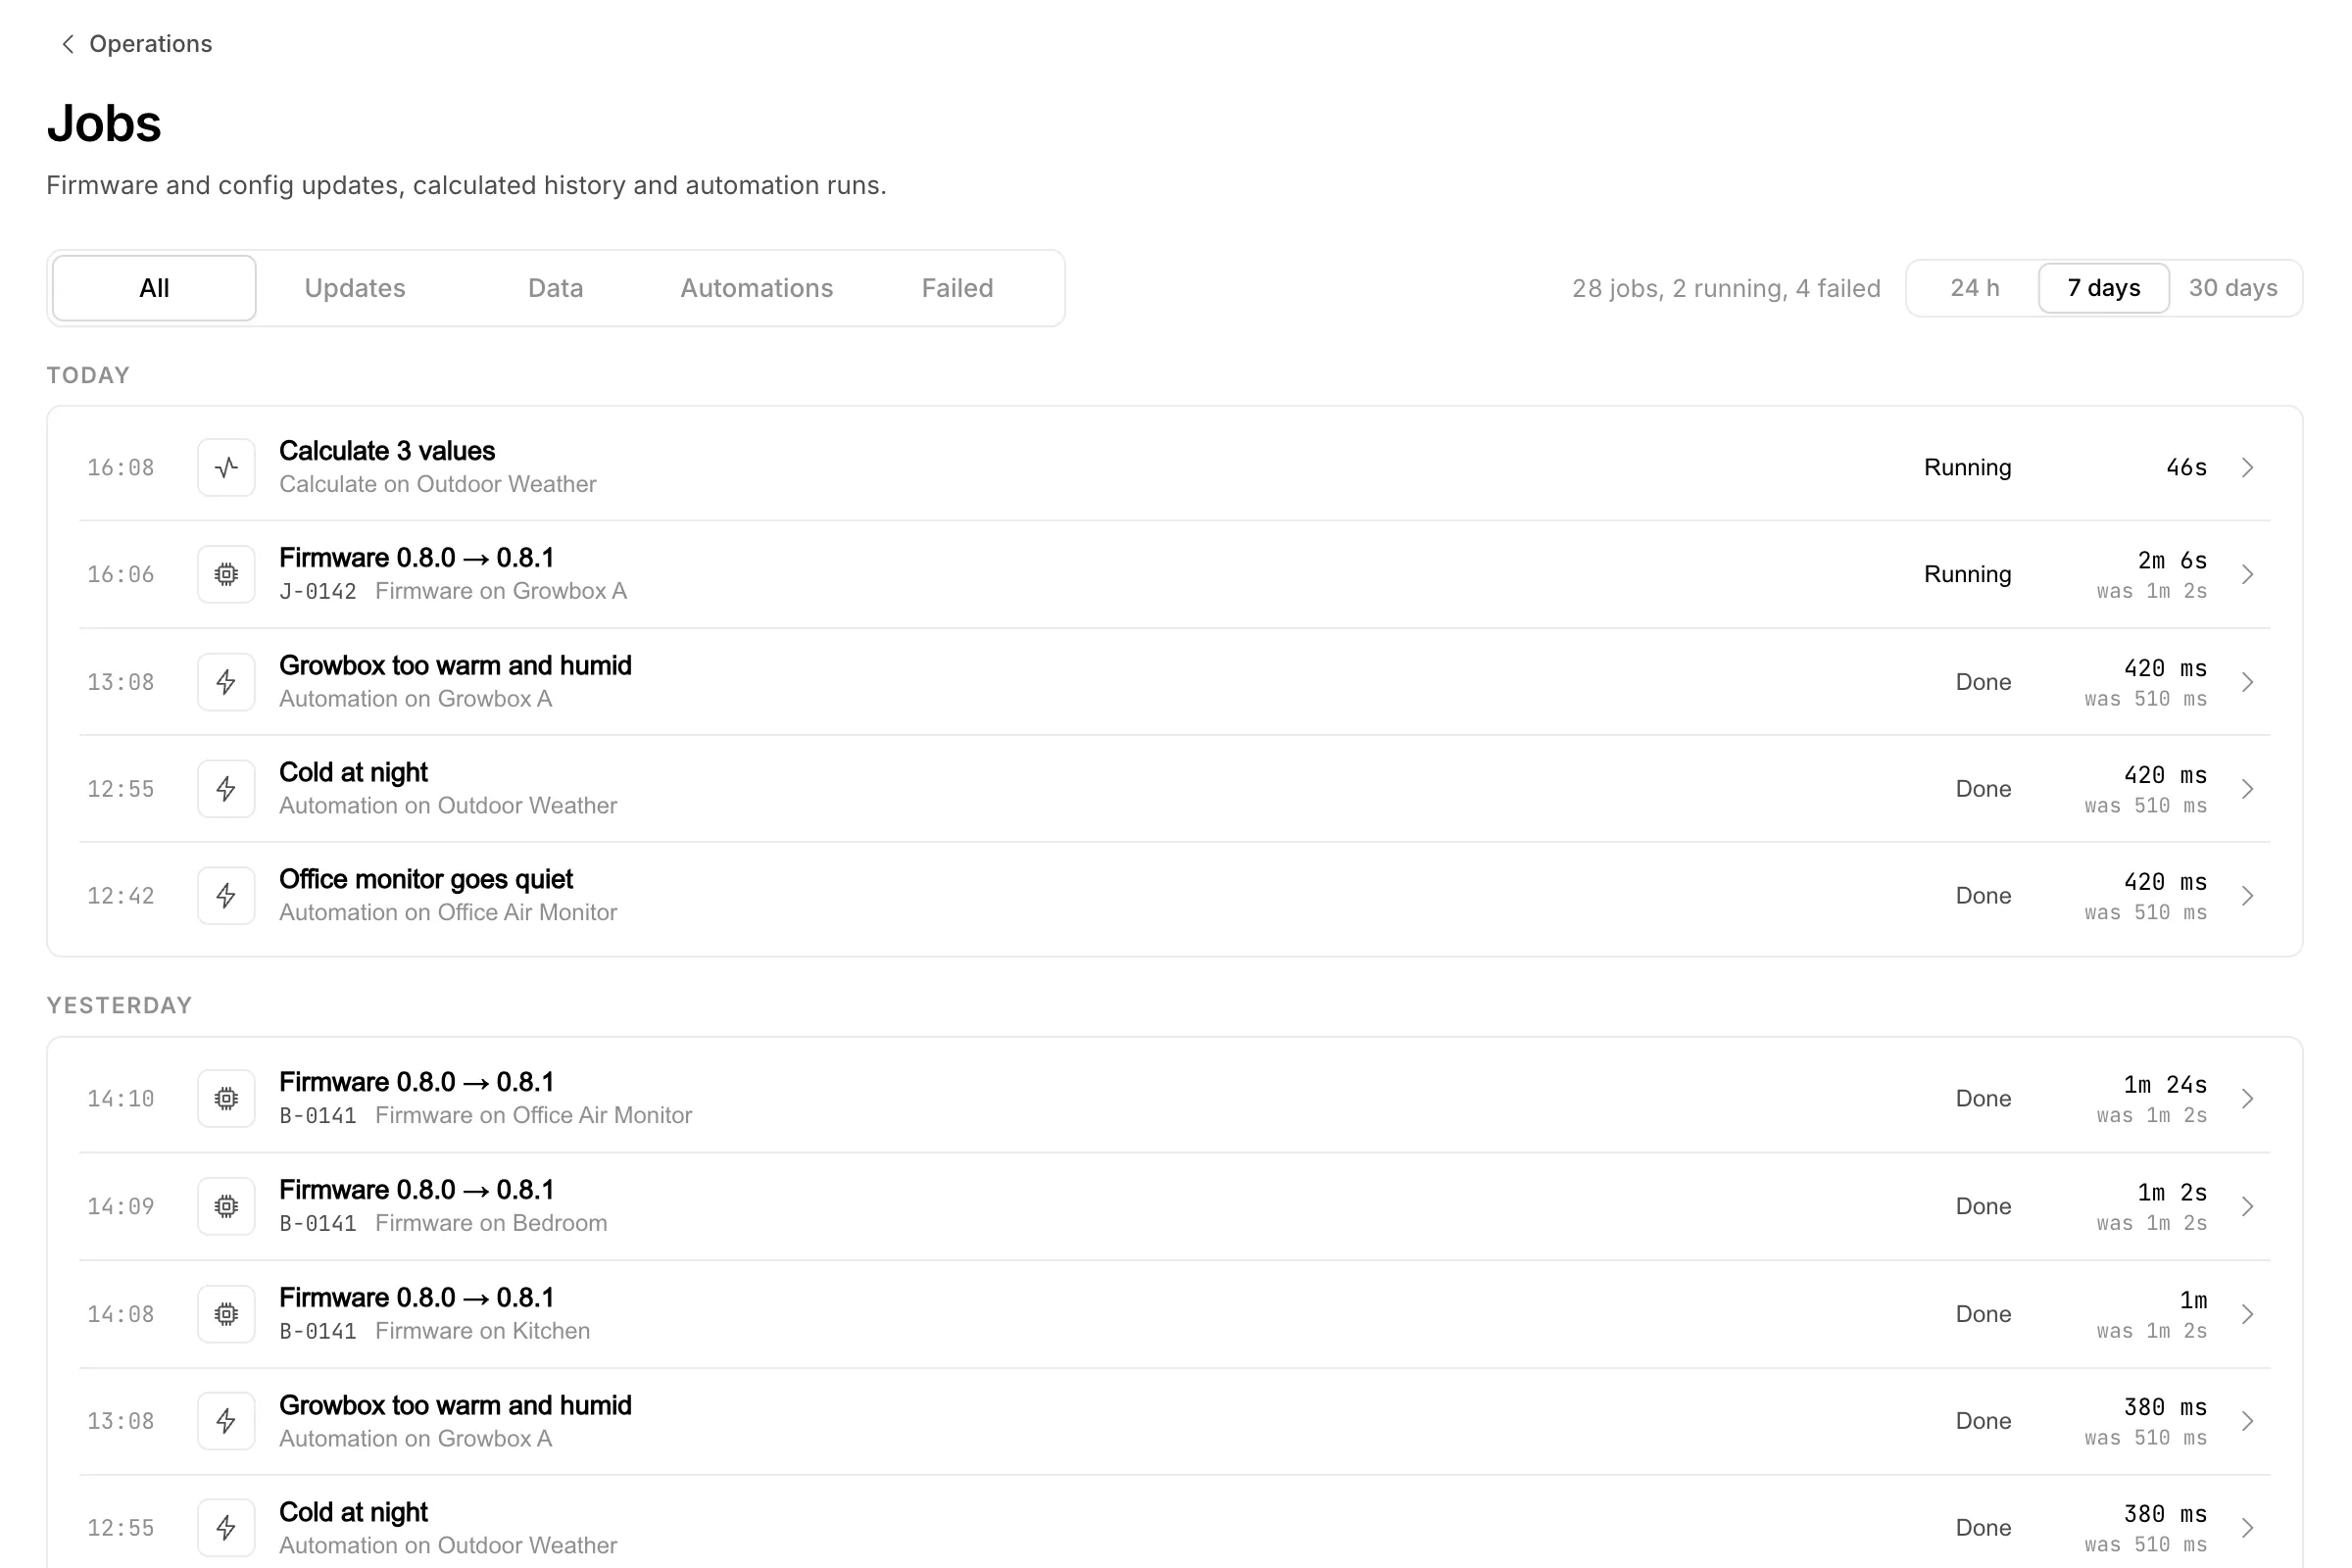
Jobs lists updates you sent from the Dashboard, values HydroNode calculated or deleted, and automation runs, grouped by day. Filter by Updates, Data, Automations or Failed, and the last 24 hours, 7 or 30 days. Each row shows how long it took and how long such a job usually takes. Open a row for its steps.
Updates over the air have more detail in the Job history of the Dashboard.