Virtual sensors and external data
Not every value needs a device. A virtual sensor shows, combines or holds values; external data brings the sun, the power price or the weather for a place. Both are sensors like any other, with charts, automations and widgets.
Three kinds of data point
Add one with + › Sensor › Virtual sensor. Its inputs are the data points of its data pool, including the ones linked in from other pools. In its settings under Sources, Add data point offers From the pool, Calculated and Set by hand. Every data point is a card with its value, the last 24 hours and where it comes from; values set by hand are changed right in the card.
| Data point | What it does |
|---|---|
| Reference | Shows a data point of the pool unchanged, without a copy. Detection and alerts stay with the source. |
| Computed | Calculated from other data points. A real data point: stored, checked for anomalies and alerted like any other. |
| Manual | A value you set: a setpoint, a mode, a switch, a grow log. Automations treat it like any value. |
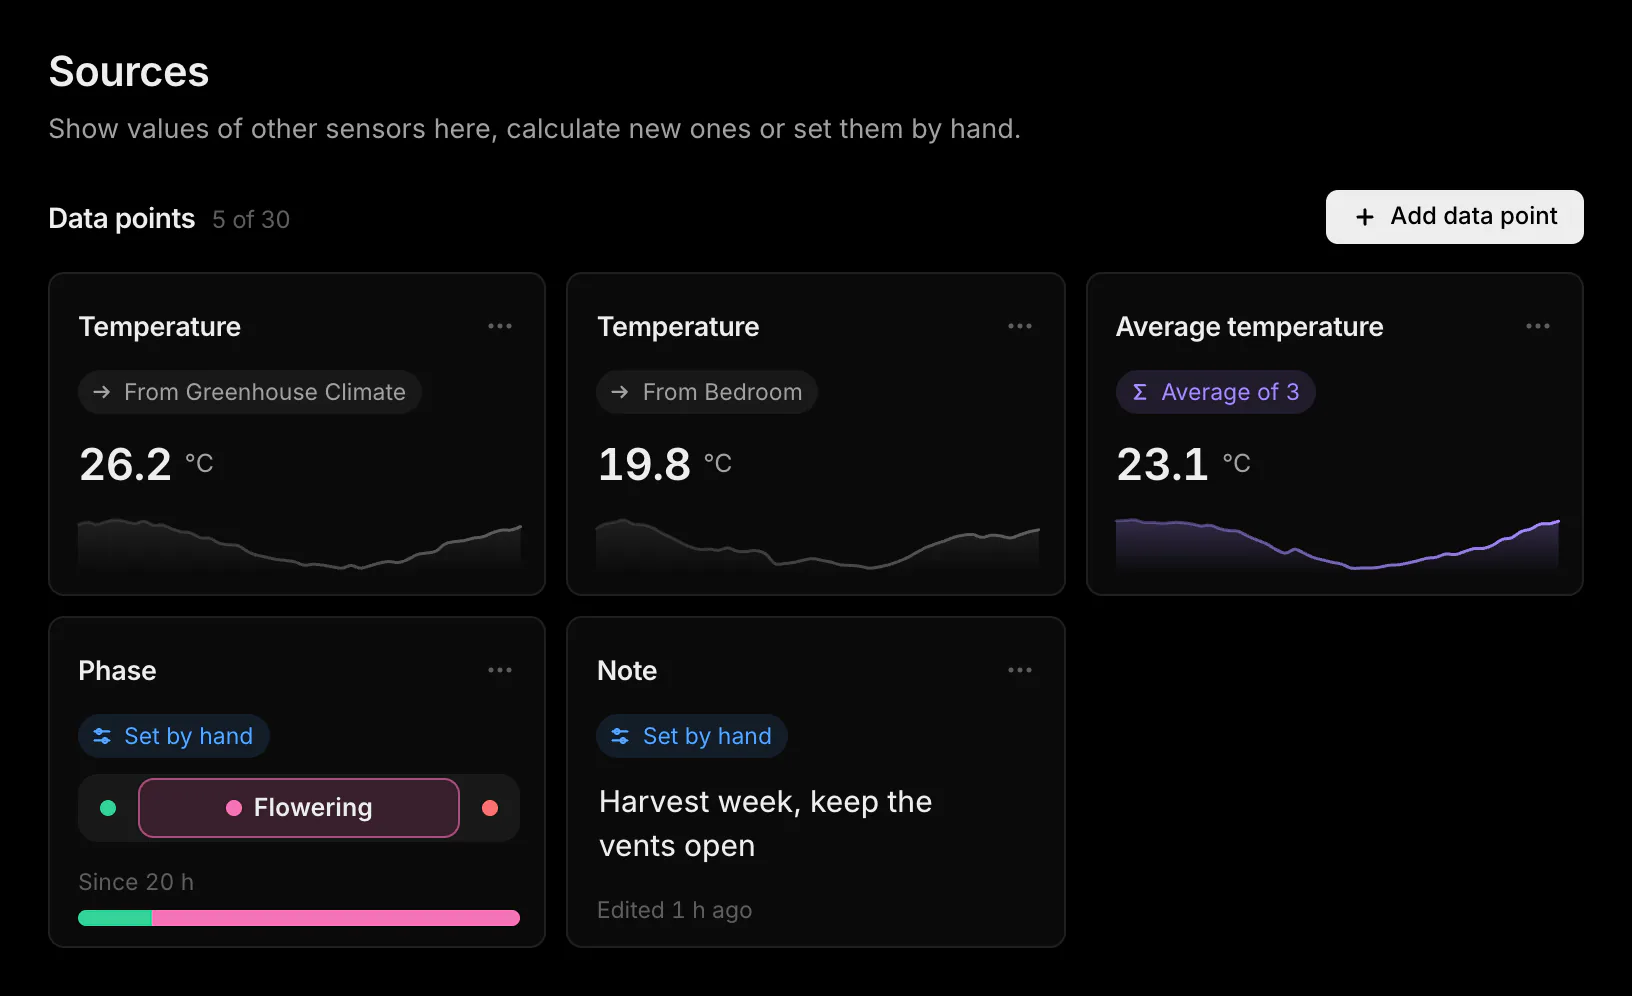
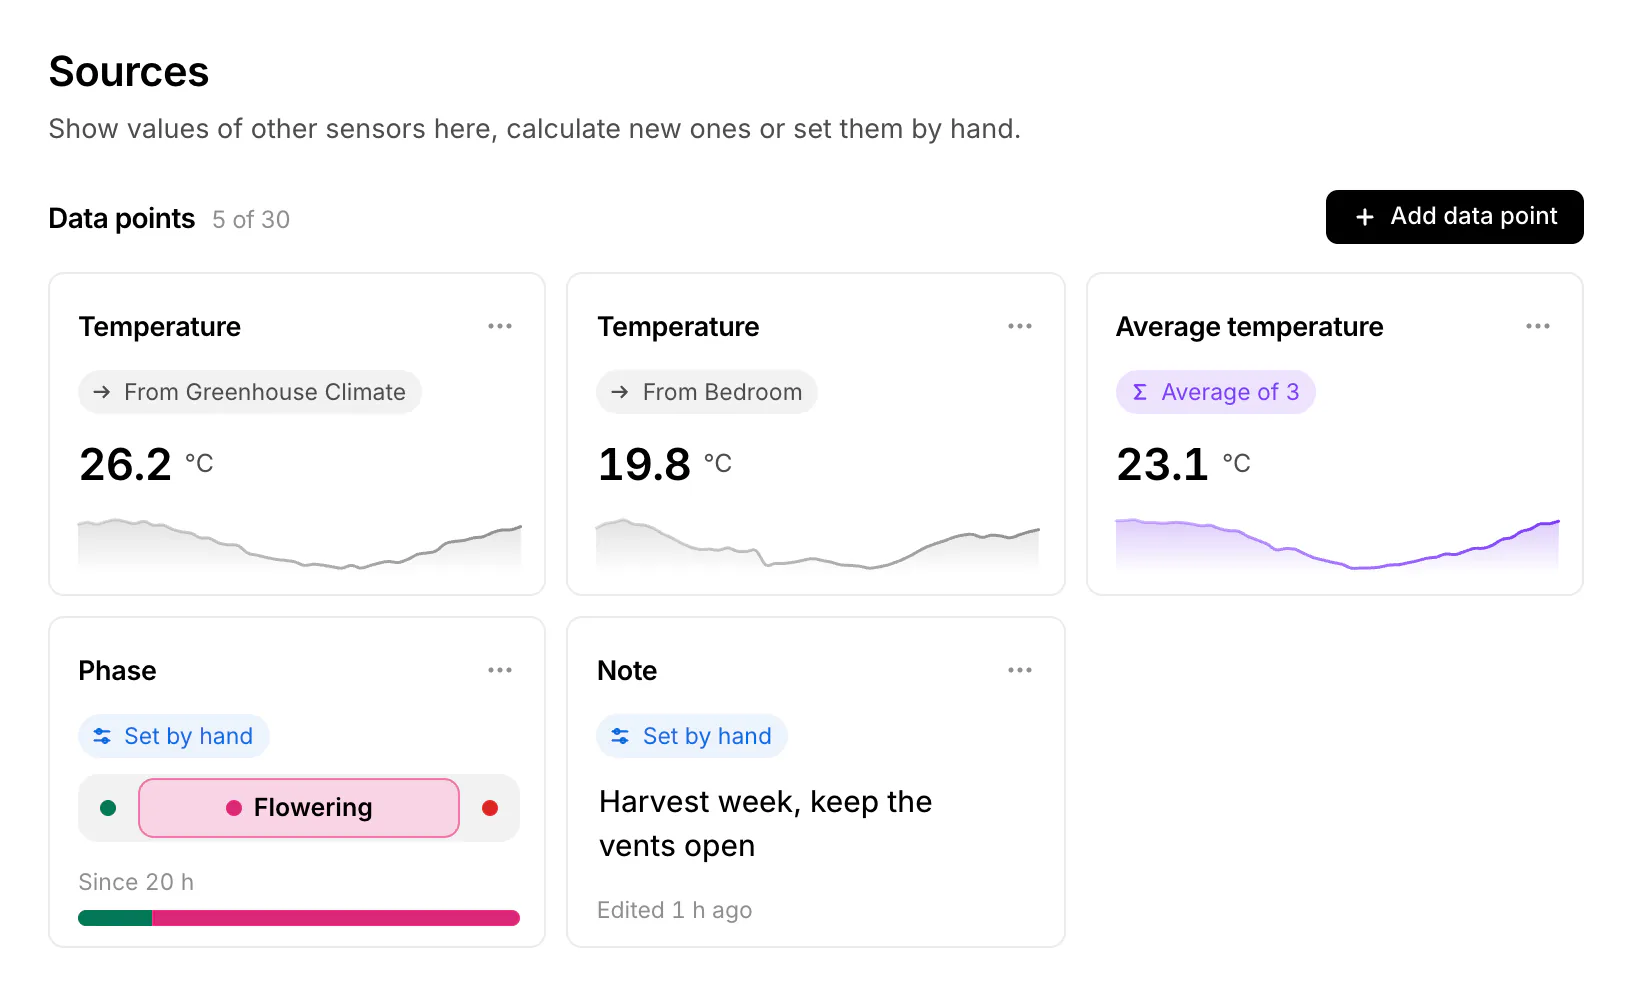
A choice set by hand shows its options as coloured segments, or as one pill that opens the list when there are more than four or the names do not fit. Under it the last 24 hours run as a band in the option colours. A note fills its card: click it to write, Enter saves, Shift+Enter starts a new line and Esc discards. A number is typed in place or moved with − and +.
The menu of a card set by hand has Edit: the name, the unit, Min, Max and Step of a number, the options of a choice with their colour and order. The kind stays, so the history fits. Removing an option the last 30 days used asks first; old readings then show its number. Cards from the pool have Rename instead, calculated ones Edit with their rule.
The cards follow one order, the same as the chart tabs and the data pool: numbers by quantity (climate, air, light and weather, soil, water, energy, radio), a calculated value right after its quantity, then on/off and choices, text last. An order set under Data points comes first. New cards show at the top until you leave the page.
Average, median, spread, count or a formula
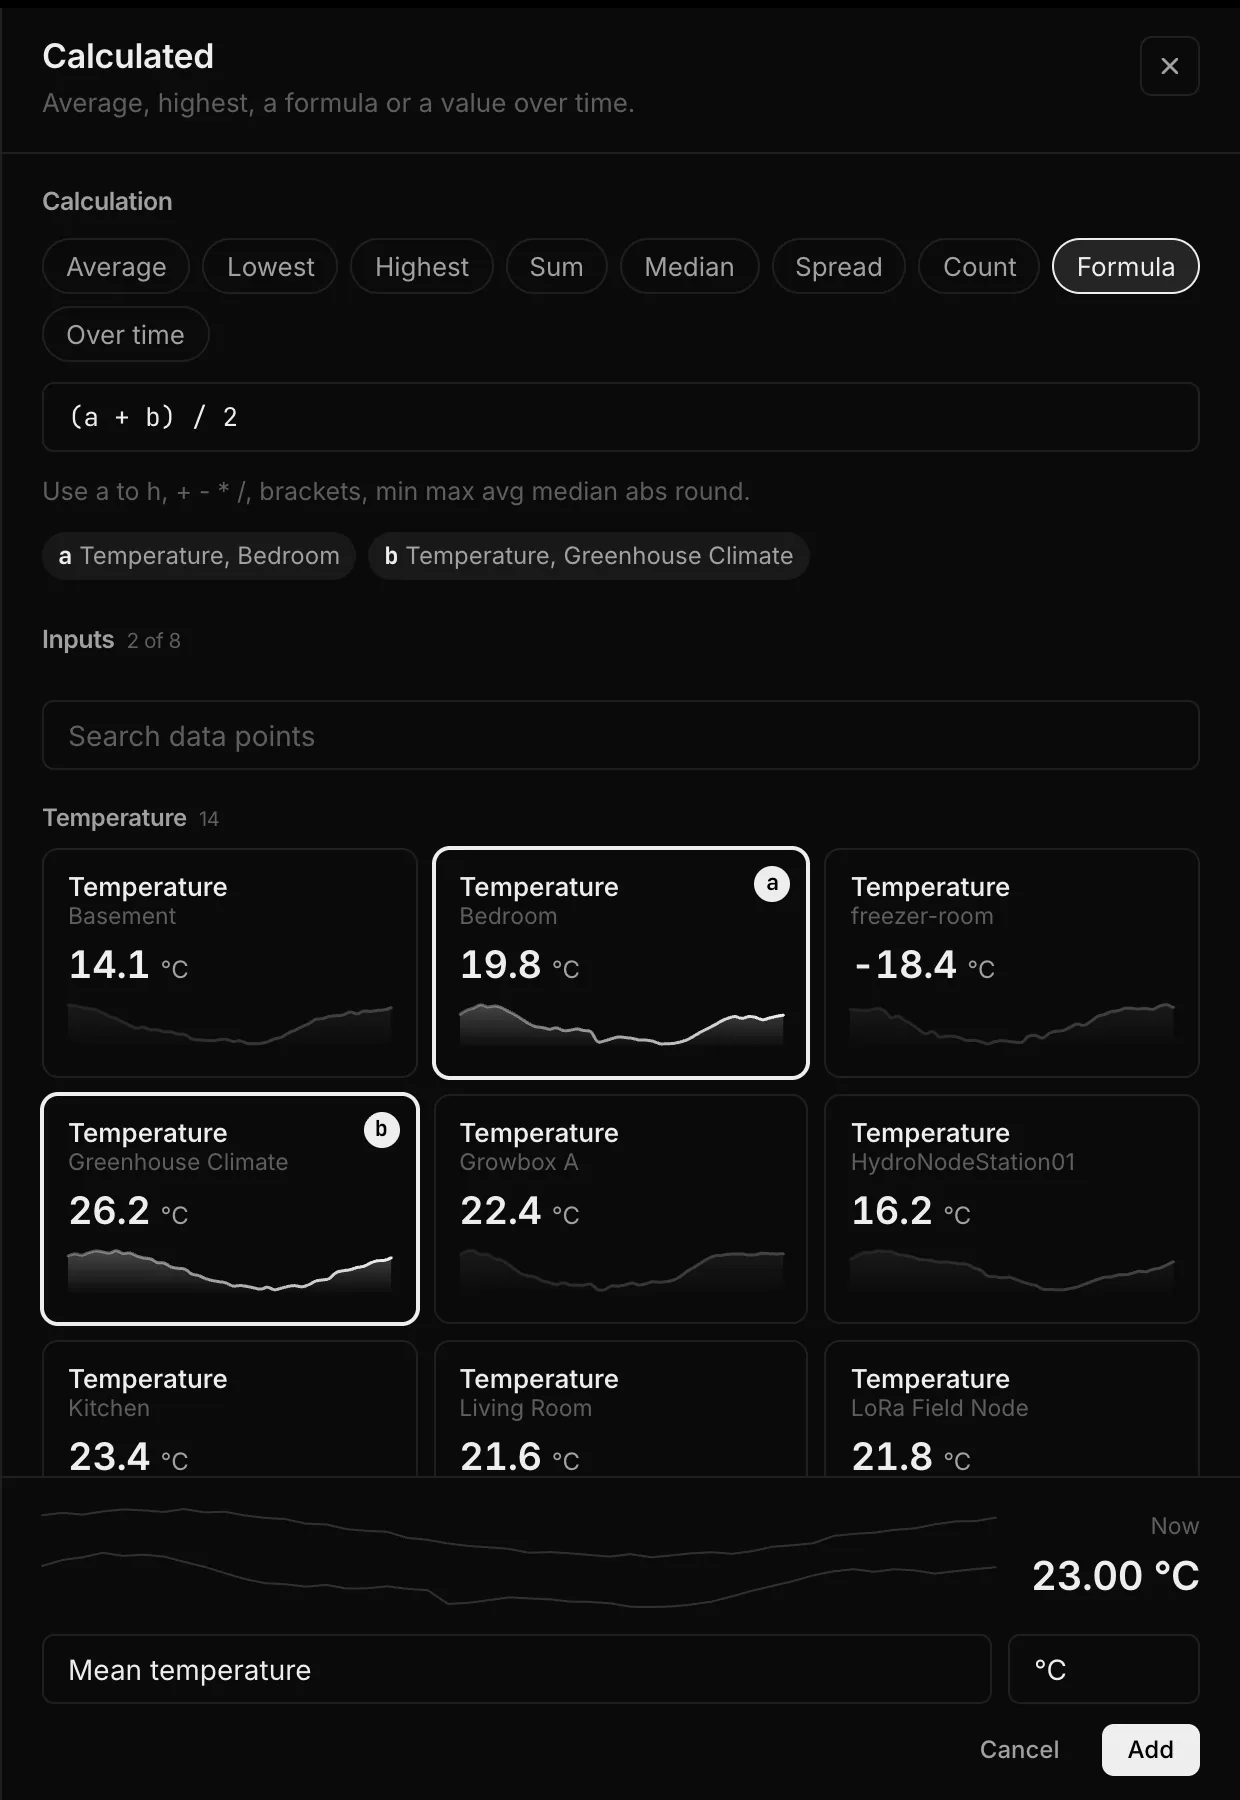
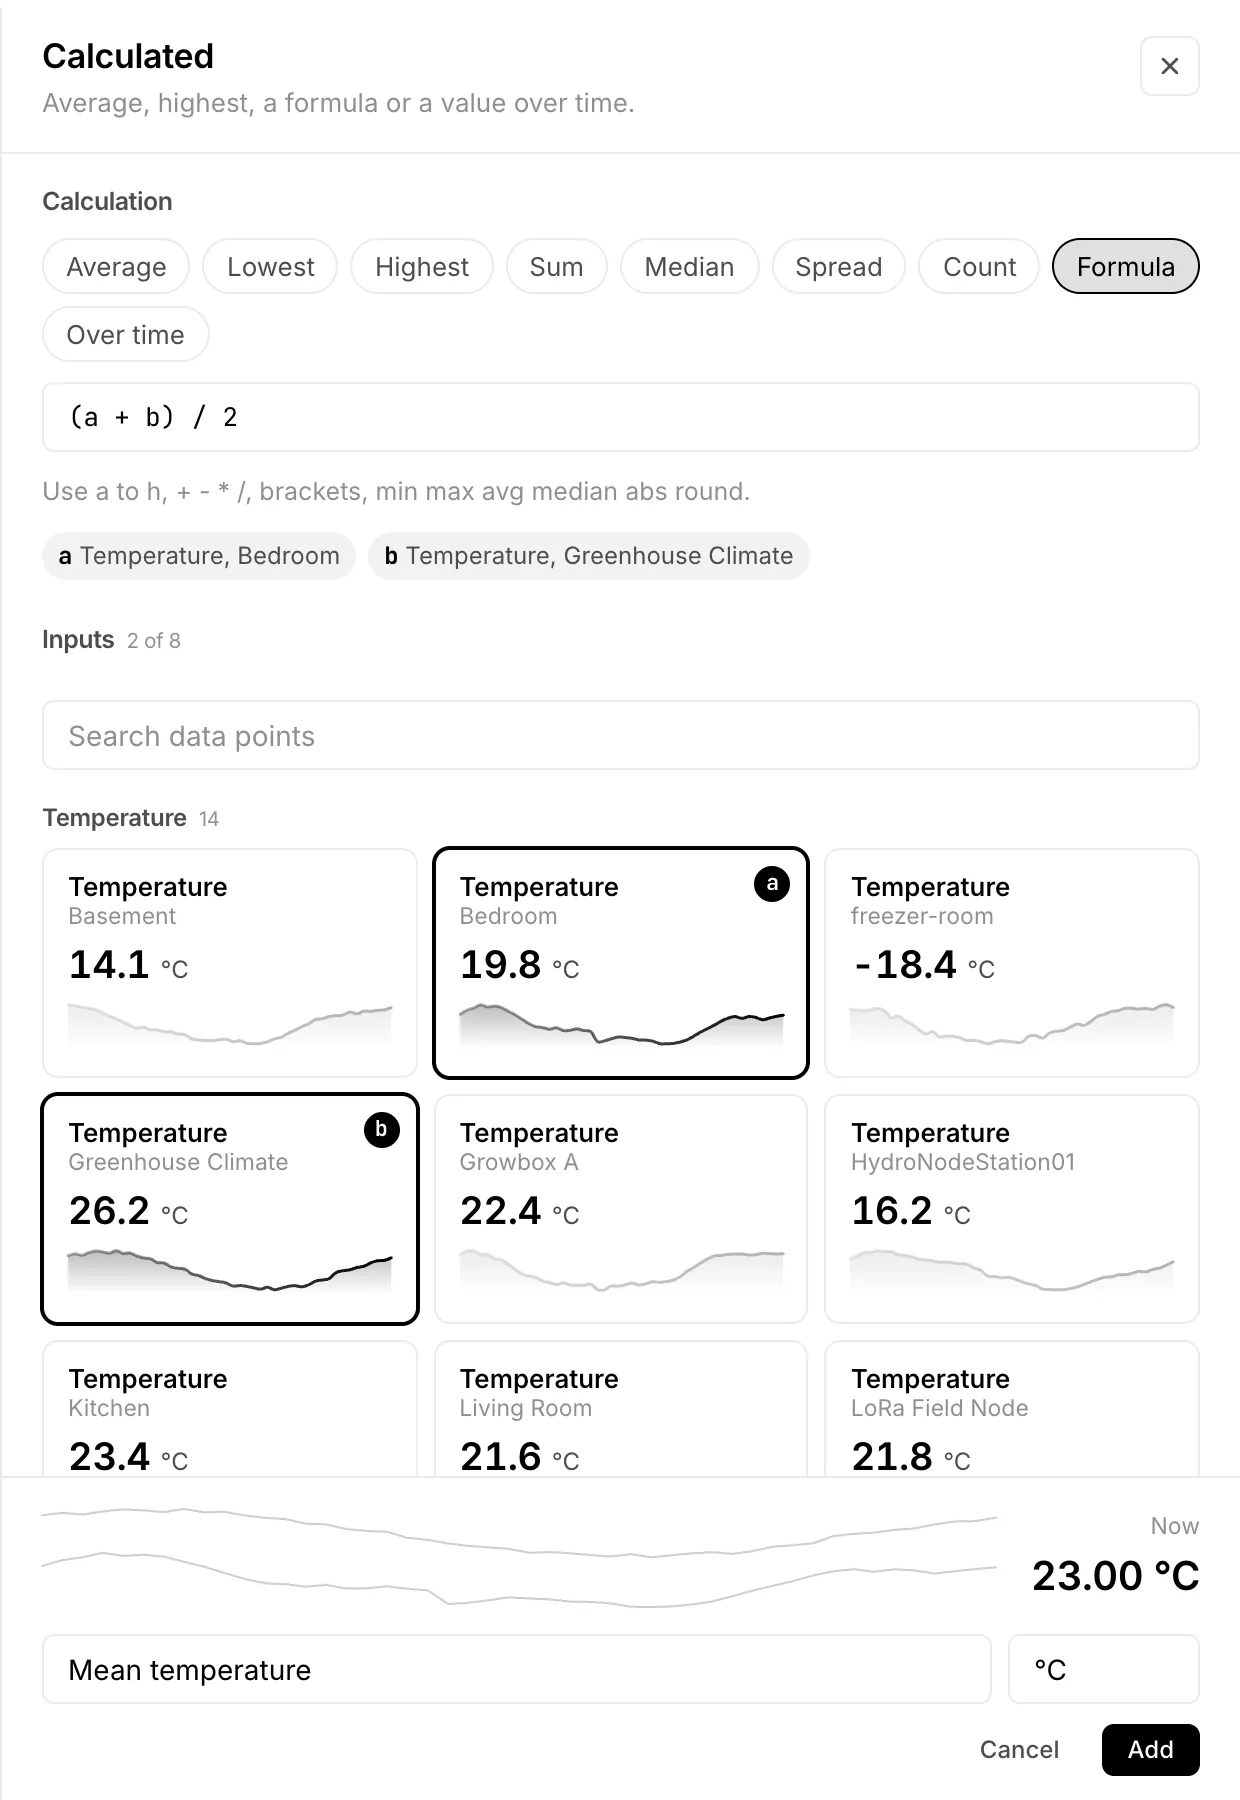
Add data point › Calculated makes a computed data point from 1 to 8 inputs, named a to h. Choose Average, Lowest, Highest, Sum, Median, Spread (highest minus lowest, needs two inputs with a value), Count (how many inputs have a recent value, no unit) or Formula. A formula may use numbers, + - * /, parentheses and min, max, avg, median, abs, round, up to 200 characters. An input older than its maximum age (default 15 minutes, Leave out inputs older than) counts as missing. A missing input or a division by zero gives no value for that moment, never 0. The drawer shows the result live, as a line over the last 24 hours, before you add it. New computed data points are calculated back over the history; after a formula change, Recalculate history does the same.
Calculated values of one sensor, such as dew point or VPD, are a separate feature and need no virtual sensor, see Calculated values.
Several sensors in one value, or one value over time
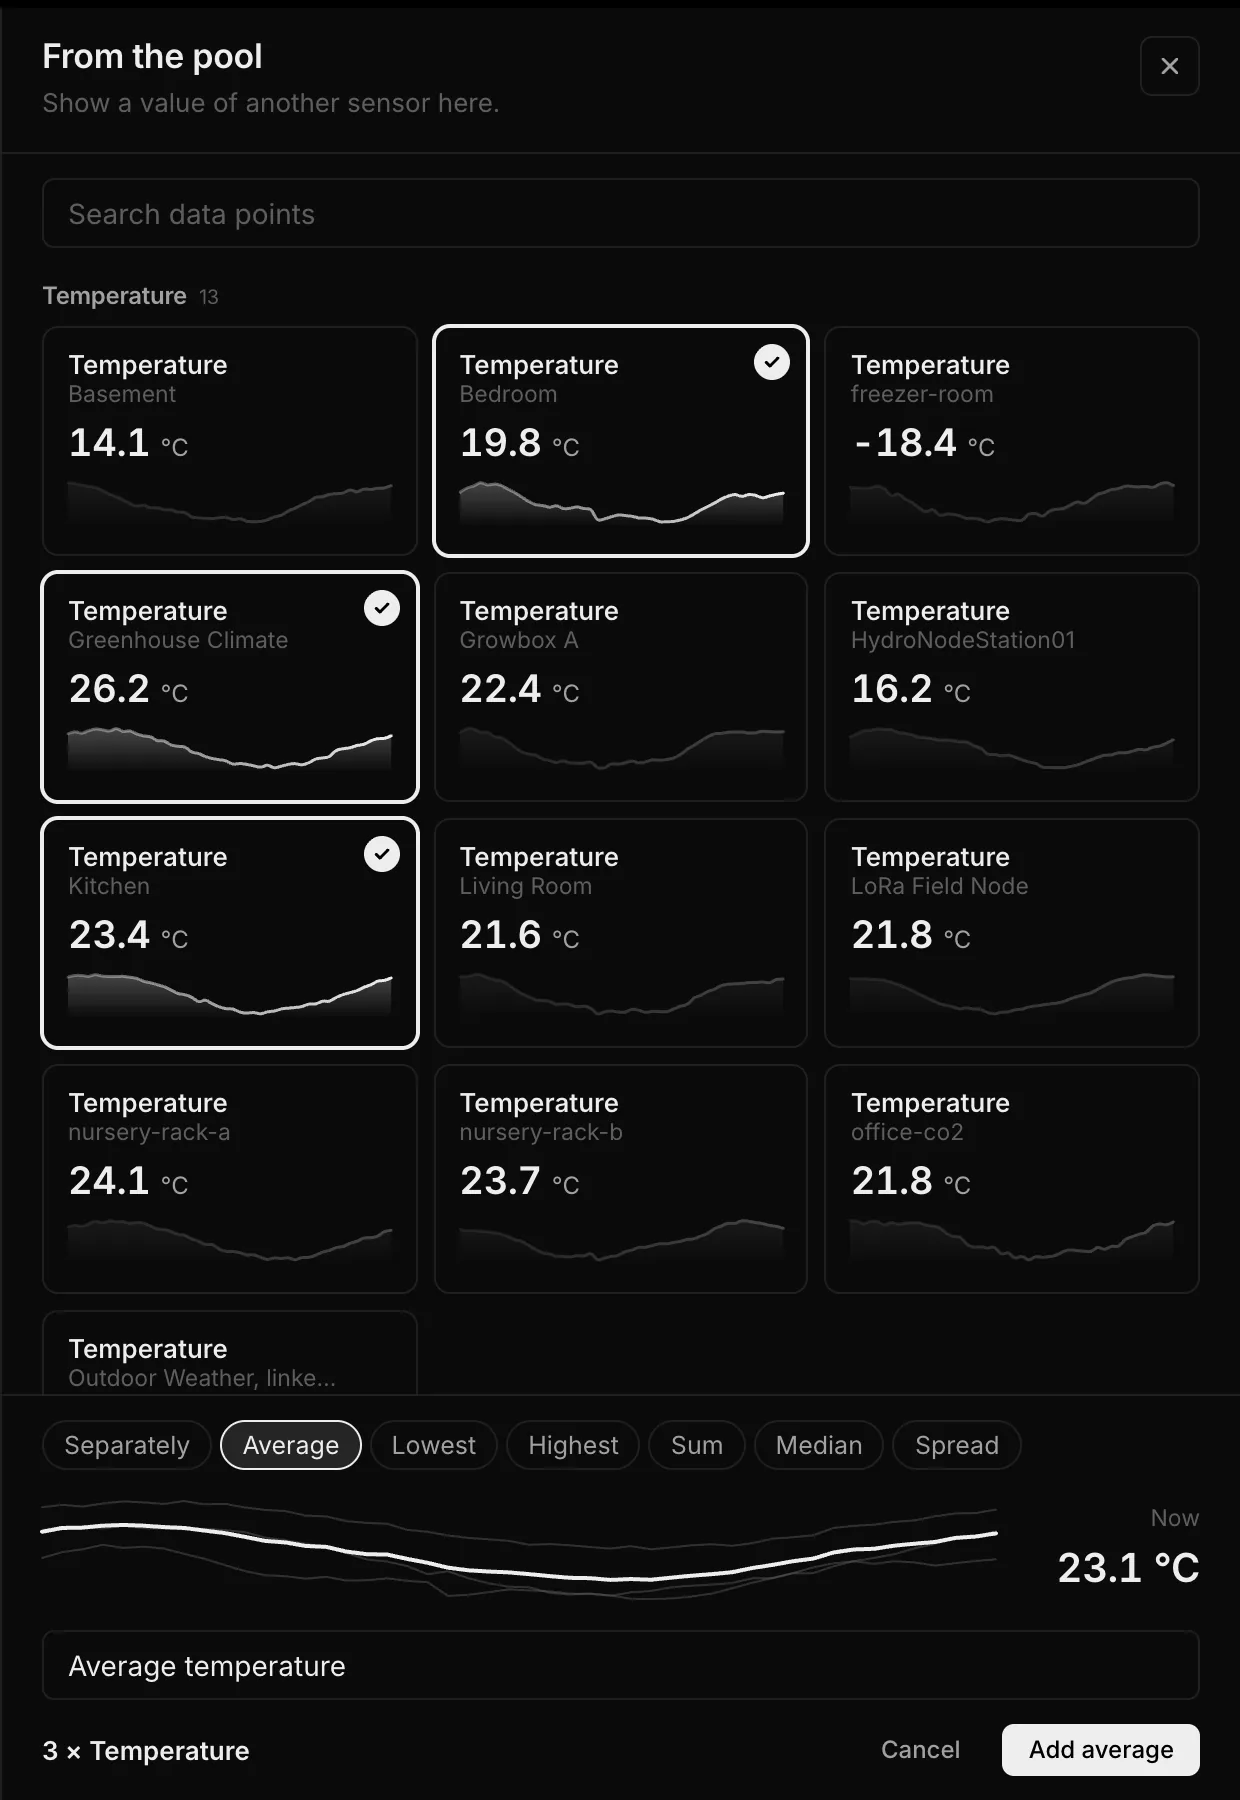
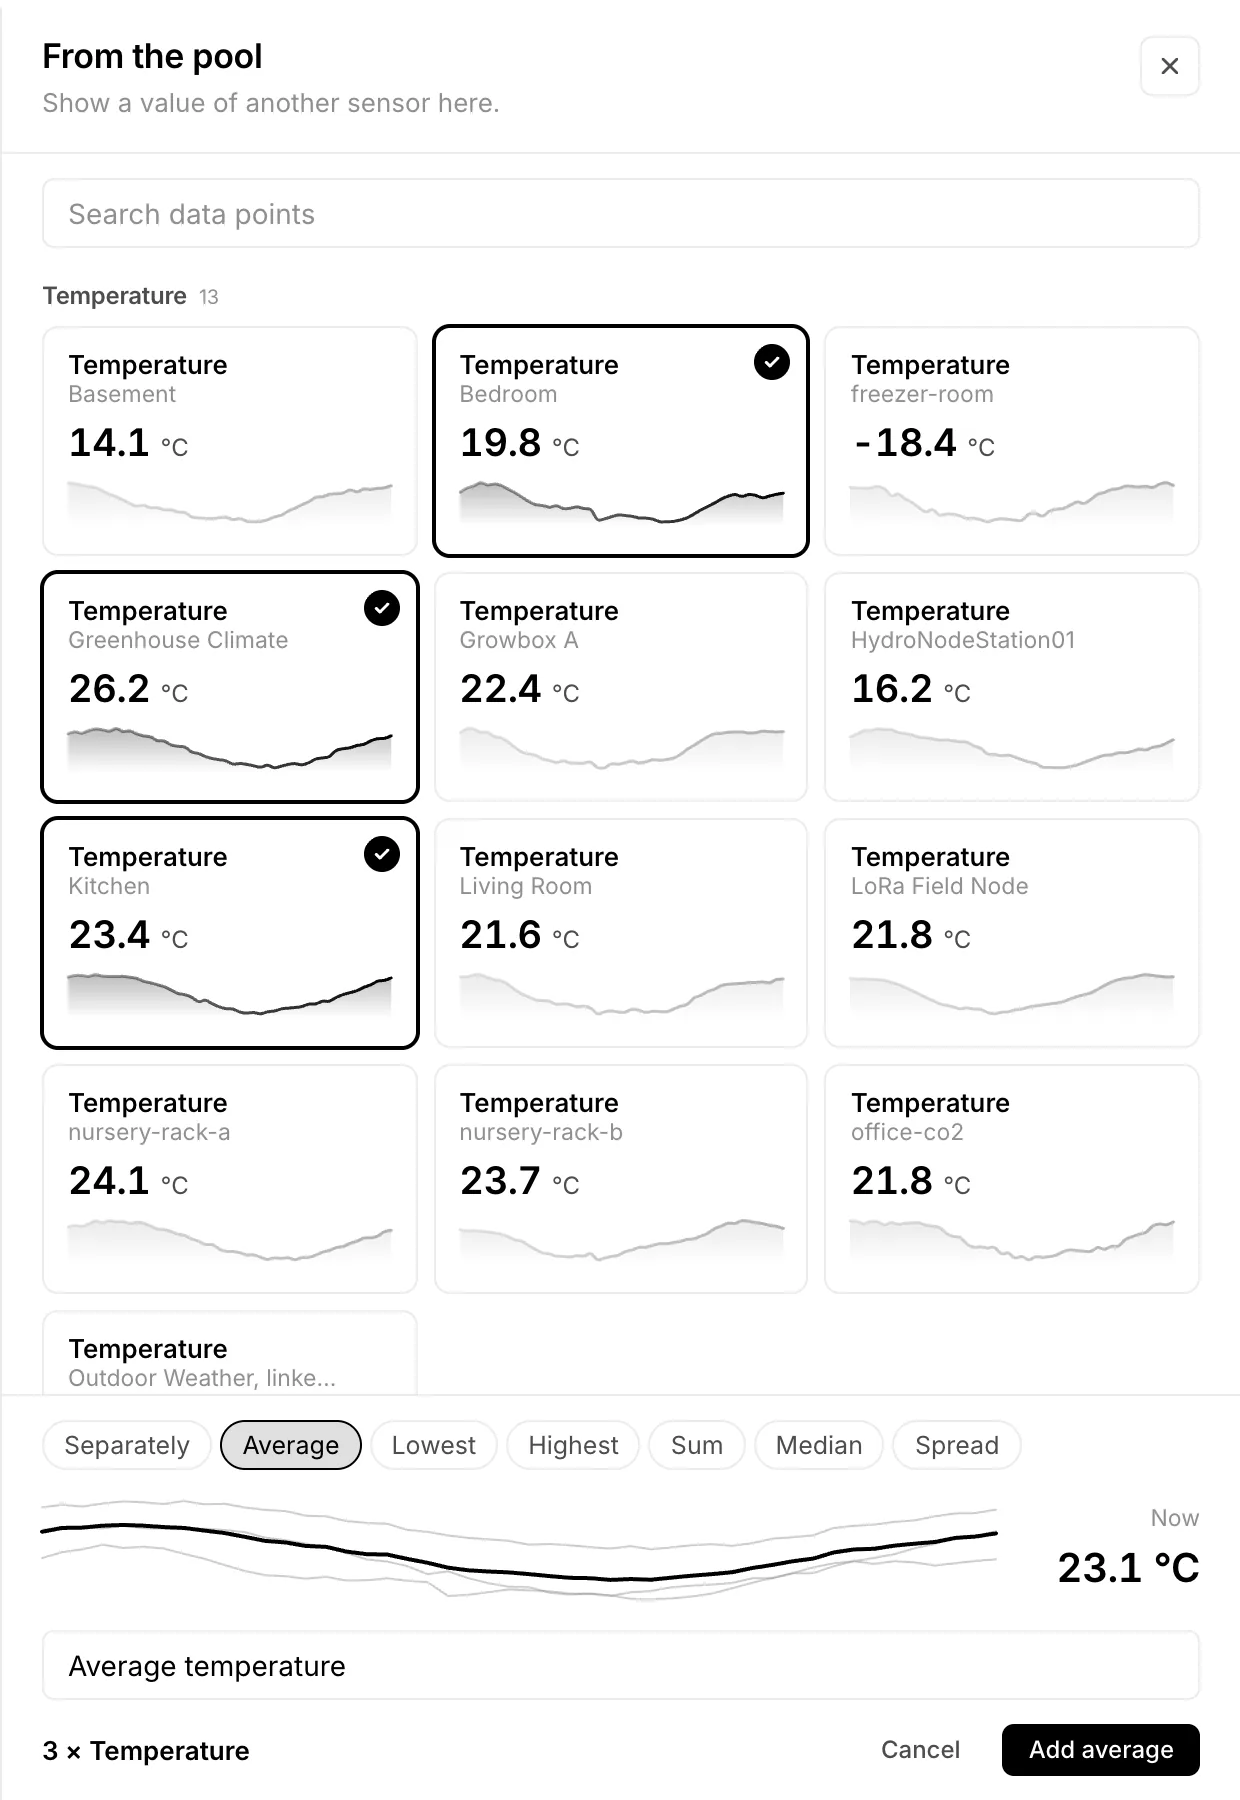
Add data point › From the pool shows every data point of the pool as a card with its value and the last 24 hours, grouped by quantity and searchable. Choose two or more of the same quantity, for example three temperatures. The drawer then offers Separately, Average, Lowest, Highest, Sum, Median and Spread, with the result line drawn over the inputs. Anything but the first adds one computed data point with a suggested name, the unit of the inputs and its history calculated back. One calculation takes at most 8 inputs; with more chosen, the drawer says that only the first 8 go in.
Over time takes exactly one input, a number, an on/off or a choice, and gives its Average, Lowest, Highest or Total over the last 1 hour, 6 hours, 24 hours or Today. Today follows the time zone of your weekly report (Operations › Reports), otherwise Europe/Berlin, and starts again at midnight: the highest temperature today, the rain today, the average of the day. The value is calculated every 5 minutes from the readings in the window; a window without readings gives no value. The average of an on/off is the share of time it was on, in percent; a total of an on/off is not possible.
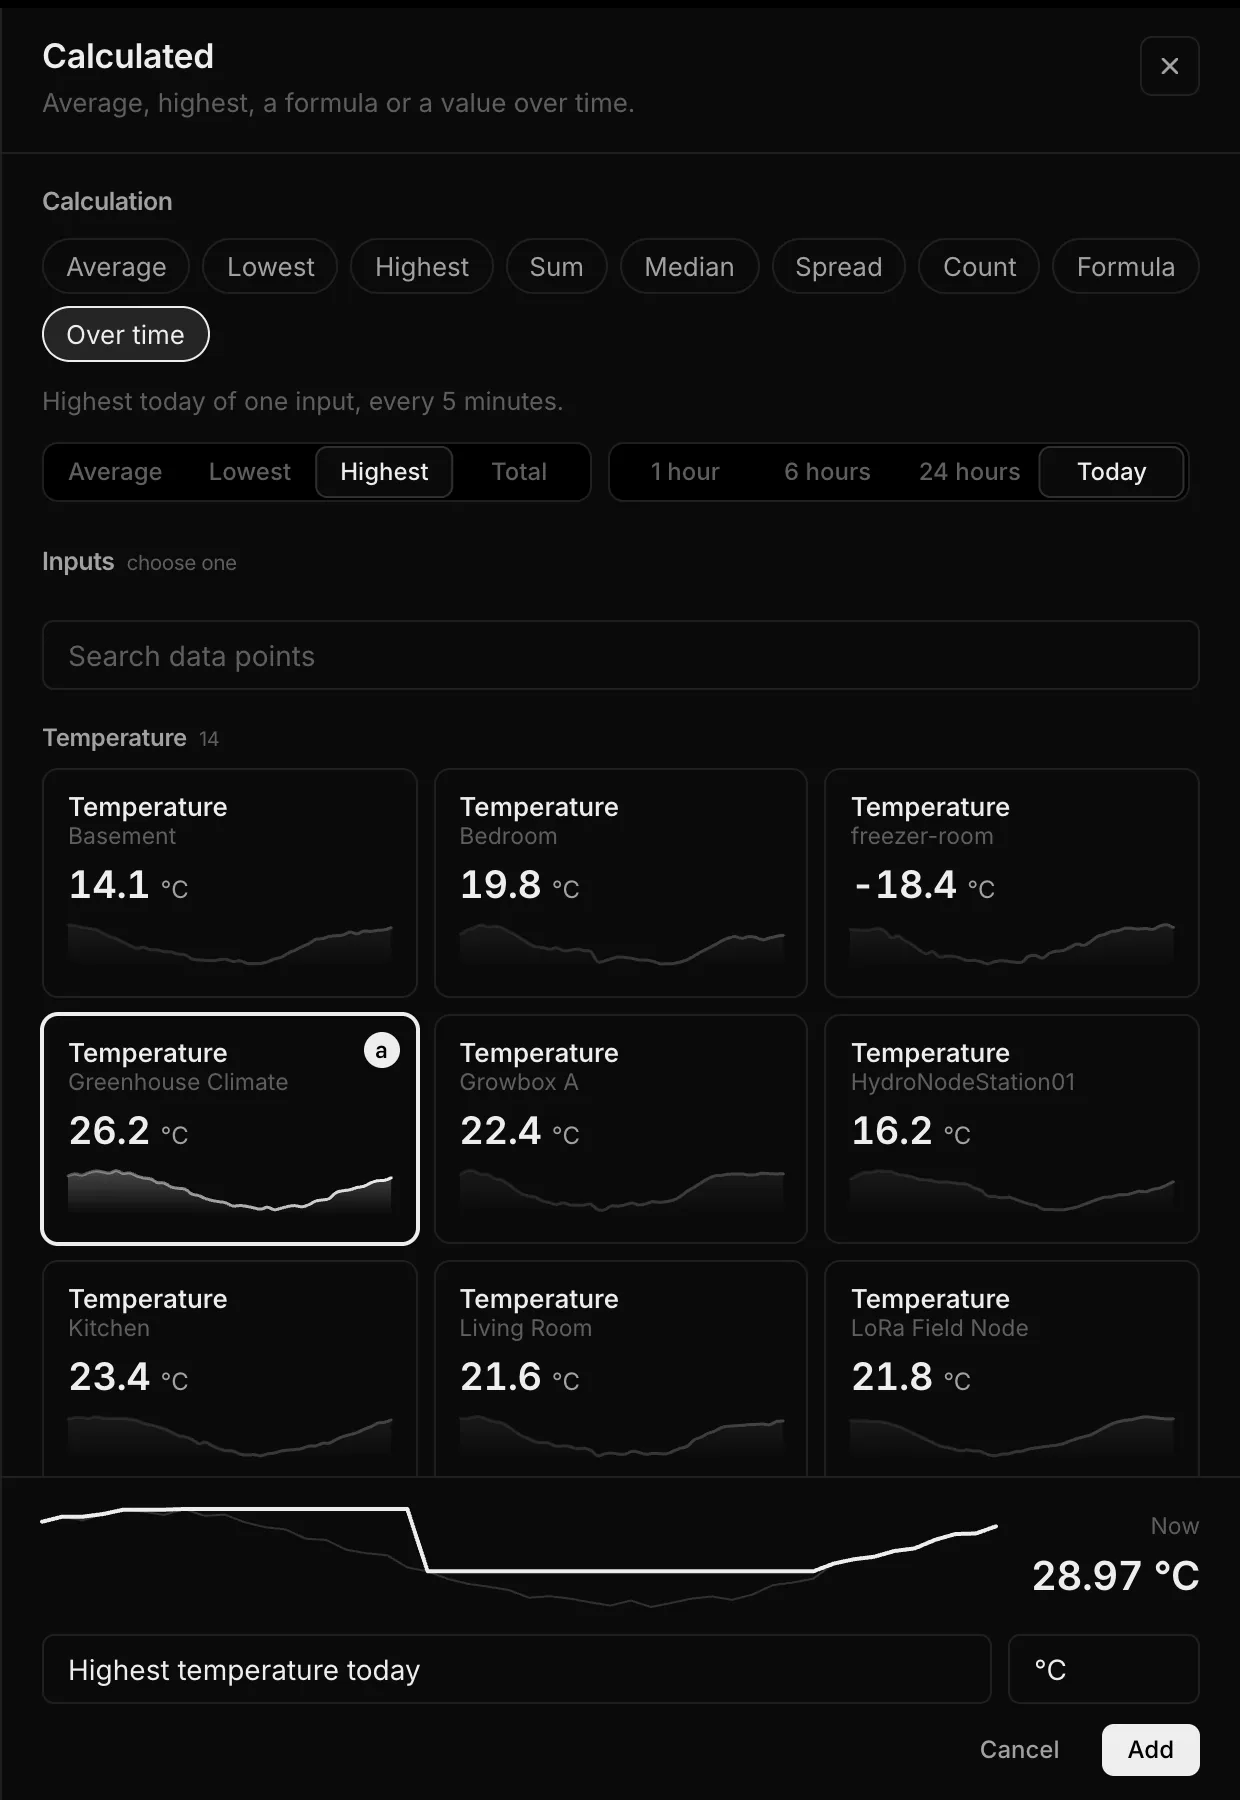
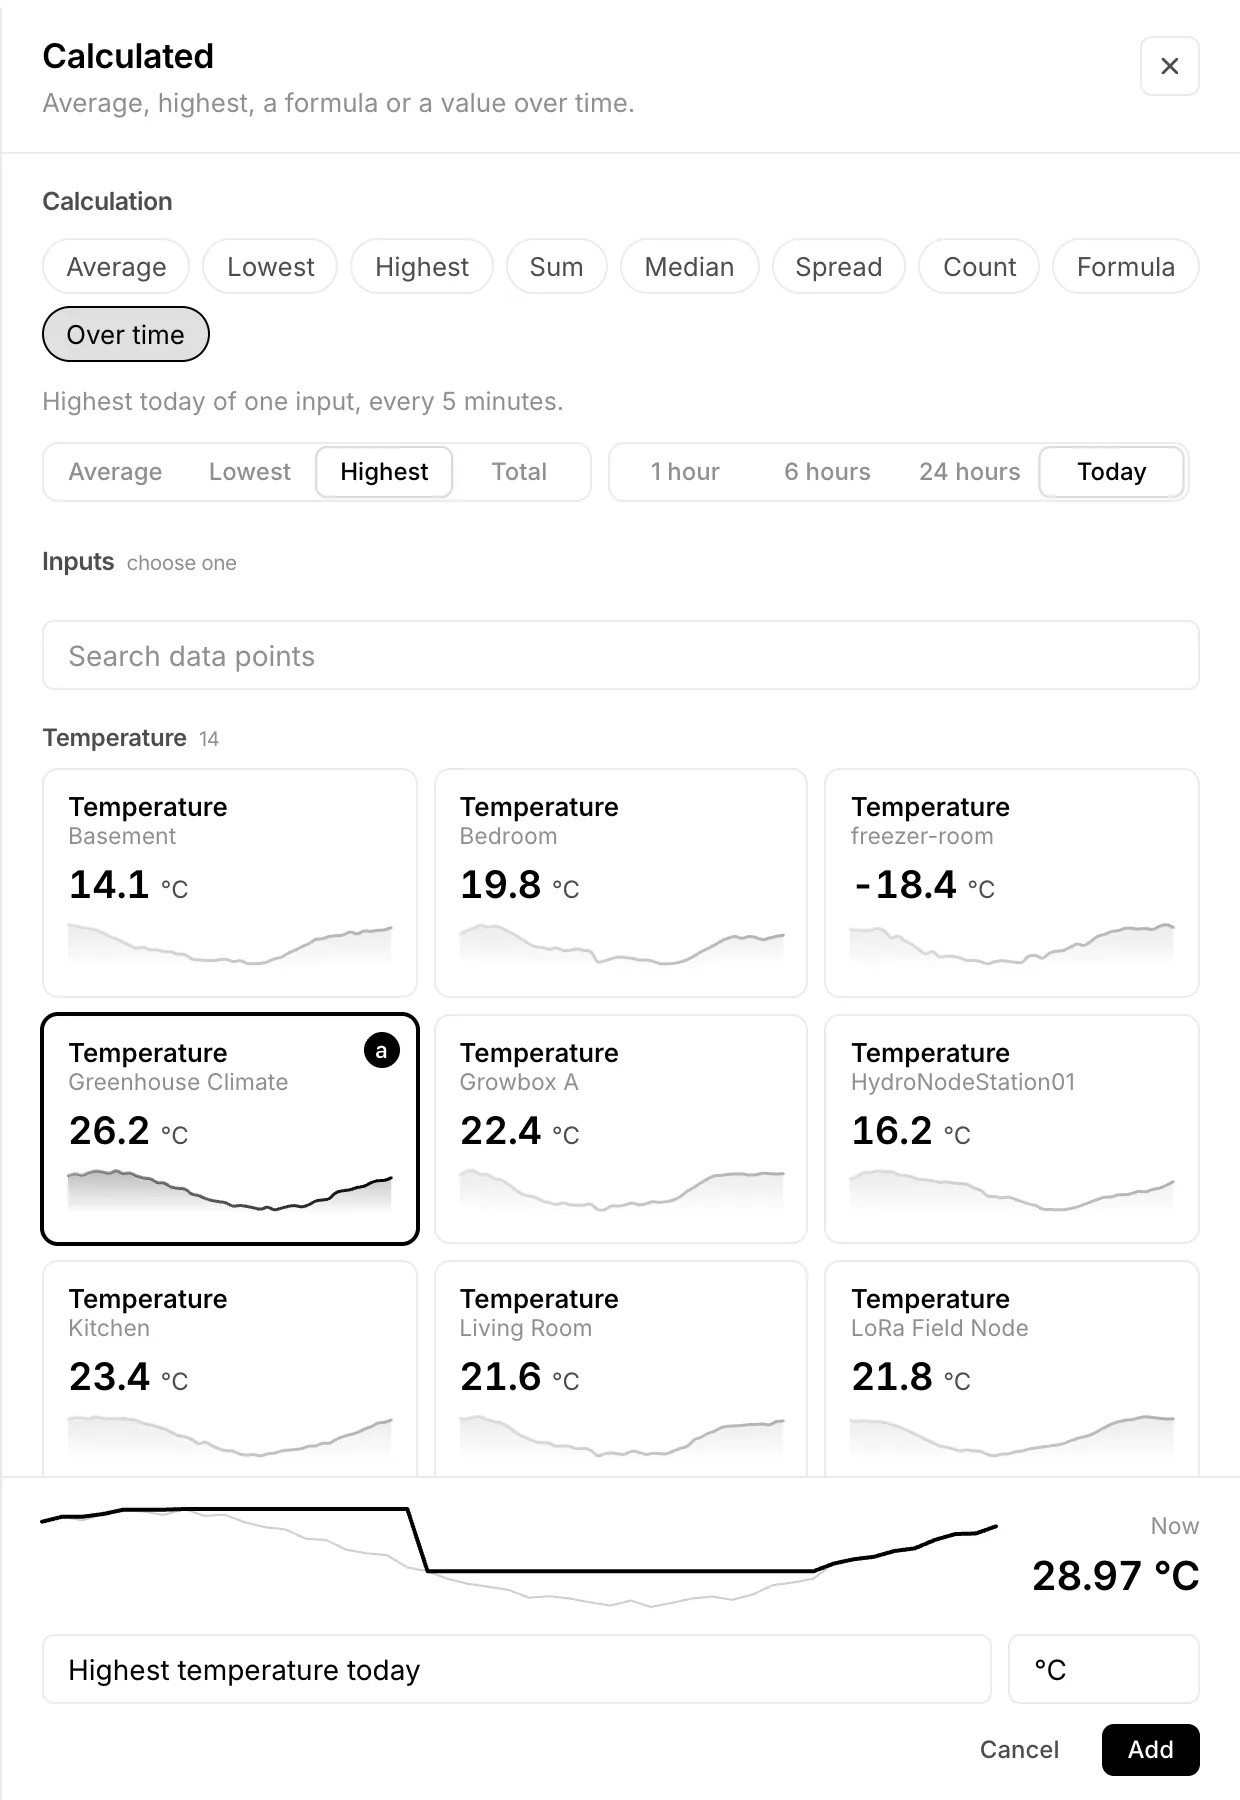
The input may be another computed data point. For the daily maximum of the average of three sensors, add the average first, then Over time with Highest and Today on it.
A virtual station
An outdoor virtual sensor may become a station, also a public one, under General › Use as a station. A public station shows linked values from another owner's project only when that link allows it.
Sun, power price, weather
+ › Sensor › External data adds one provider per pool. Sun and weather use the project's location unless you give another place. External sensors do not count toward your 20 sensors. They have no anomaly detection, AI analysis or offline alerts.
| Provider | Data points | Source |
|---|---|---|
| Sun | Sun elevation, Sun azimuth, Daylight, Minutes to sunrise, Minutes to sunset (every 5 minutes) | Calculated by HydroNode |
| Power price | Price now, Price in 1 hour, Lowest today, Highest today in ct/kWh, net wholesale (zones DE-LU and AT) | Energy-Charts, day-ahead price |
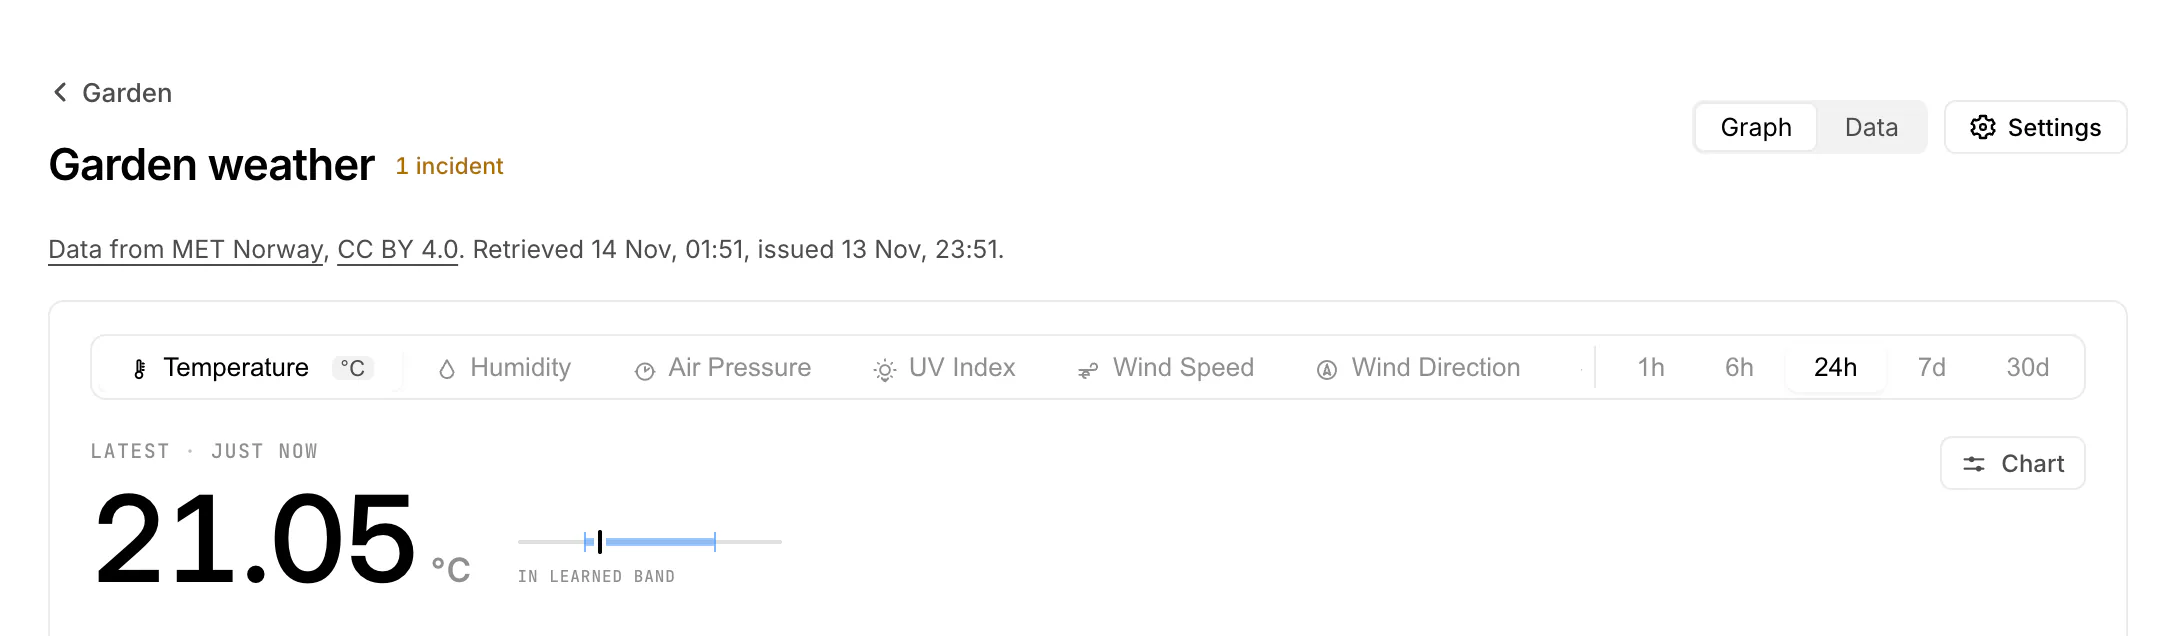
| Weather | Temperature, Humidity, Pressure, Wind, Wind direction, Cloud cover, UV index, Rain next hour, Temperature in 3 hours | MET Norway forecast, CC BY 4.0 |
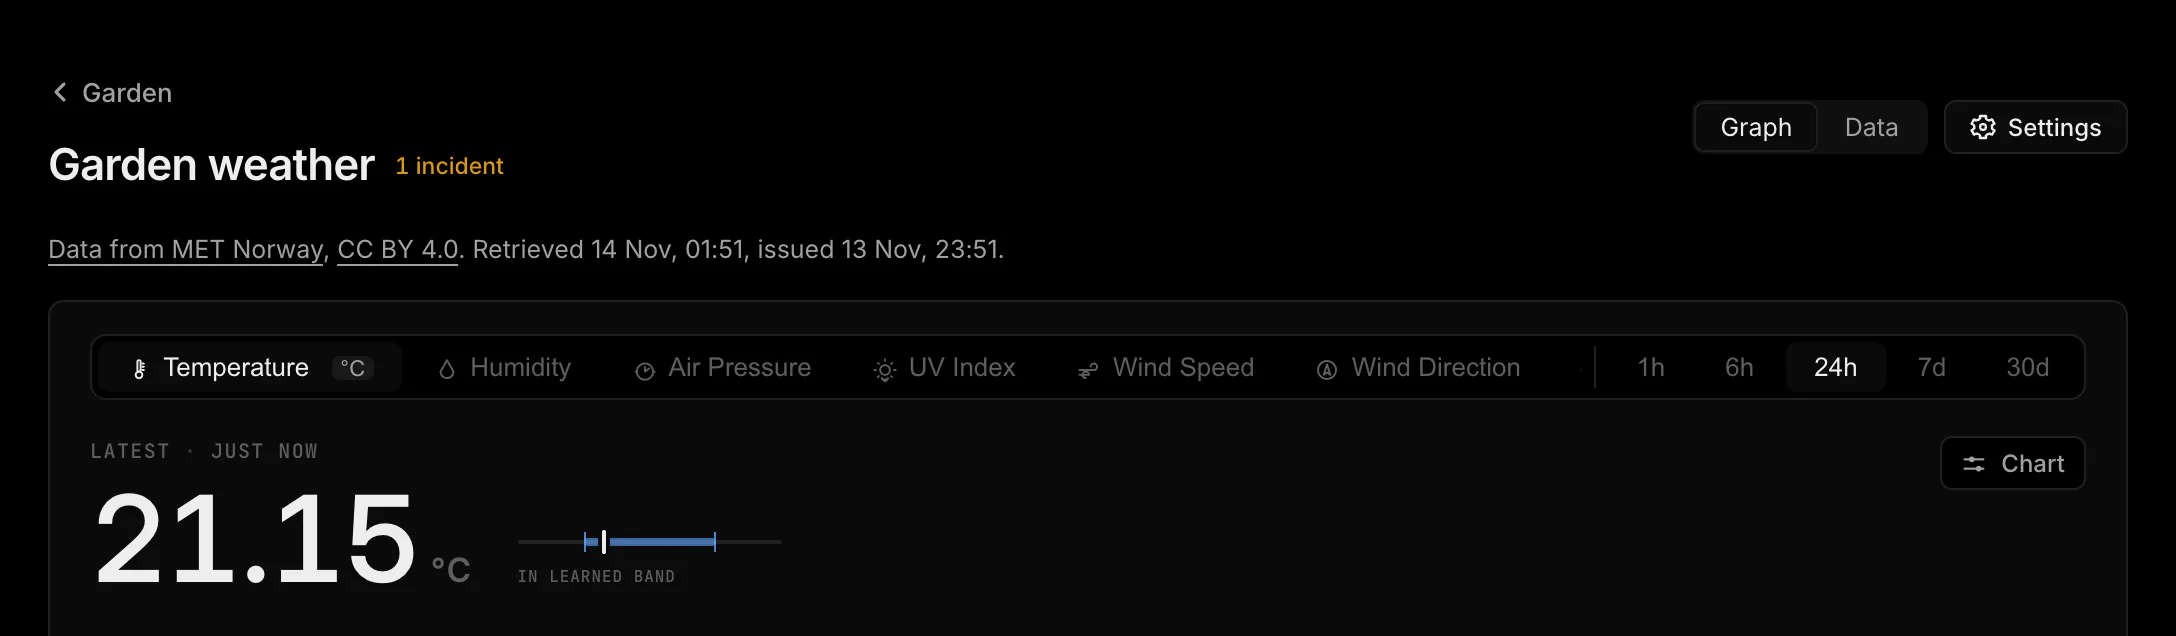
Typical use: an automation that runs the pump only when Price now is low, or closes a vent when Rain next hour is above zero.